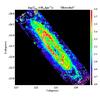
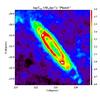
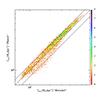
Fig. A.1
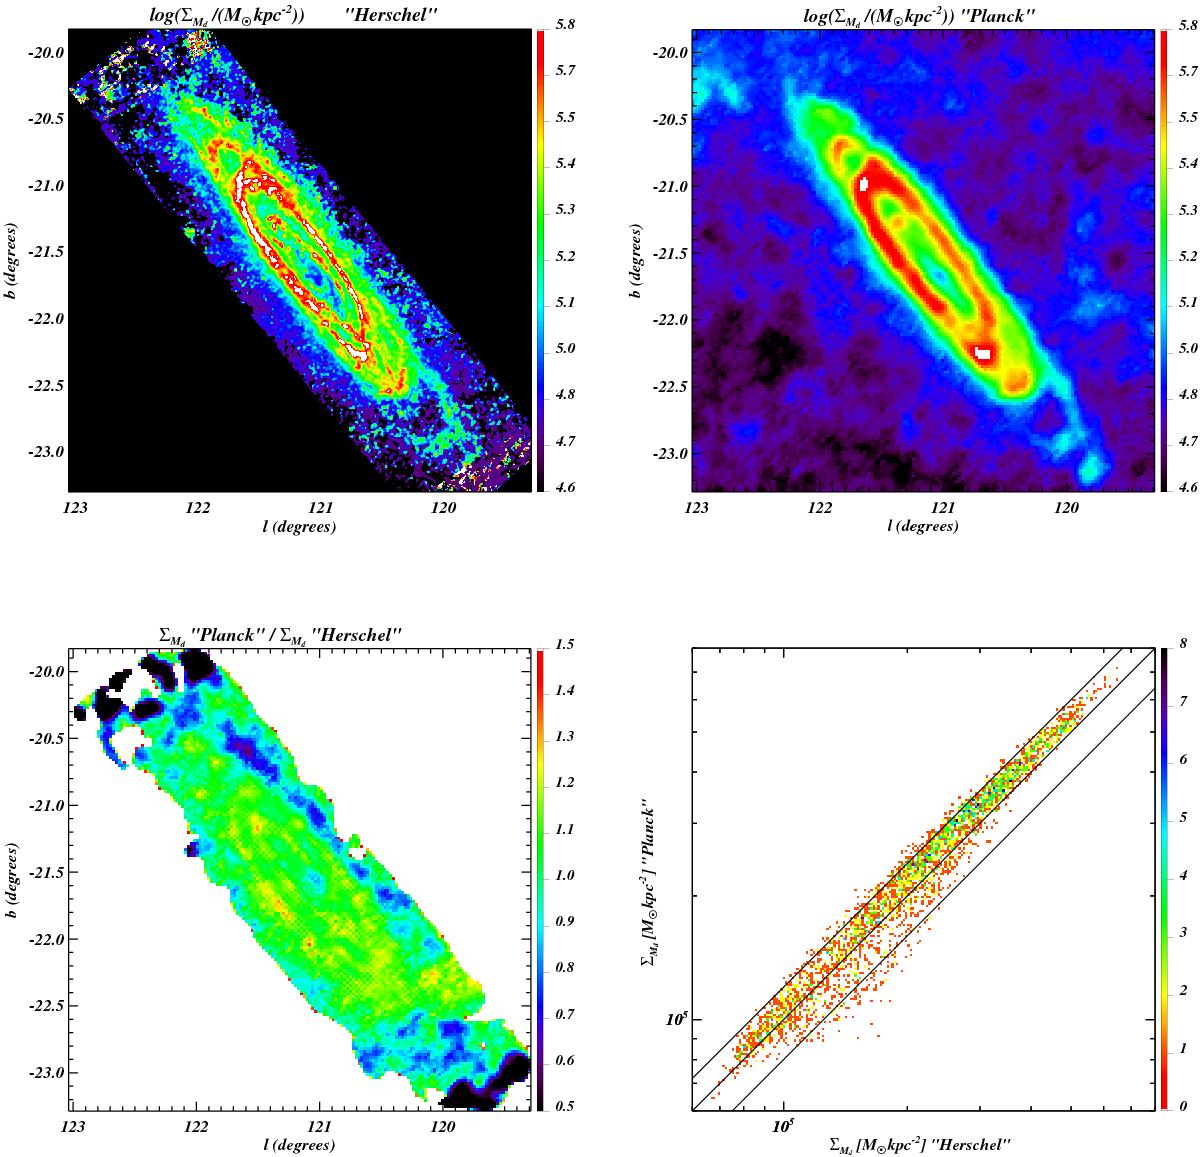
Comparison of M31 maps as seen by Herschel and Planck. The top row shows maps of the dust mass generated using Spitzer and Herschel data at high resolution (left) and the current estimates using IRAS and Planck data (right). The bottom row shows the ratio map of the two mass estimates (convolved to a common resolution and with the zero level matched) on the left, and their scatter on the right. The diagonal lines in the bottom right panel correspond to a one-to-one relationship and a ± 20% difference about that. The colour in the last panel corresponds to the density of points. Even though the two analyses are based on completely independent data, they agree remarkably well, differing by less than 10% across most of the galaxy.
Current usage metrics show cumulative count of Article Views (full-text article views including HTML views, PDF and ePub downloads, according to the available data) and Abstracts Views on Vision4Press platform.
Data correspond to usage on the plateform after 2015. The current usage metrics is available 48-96 hours after online publication and is updated daily on week days.
Initial download of the metrics may take a while.