Fig. 16
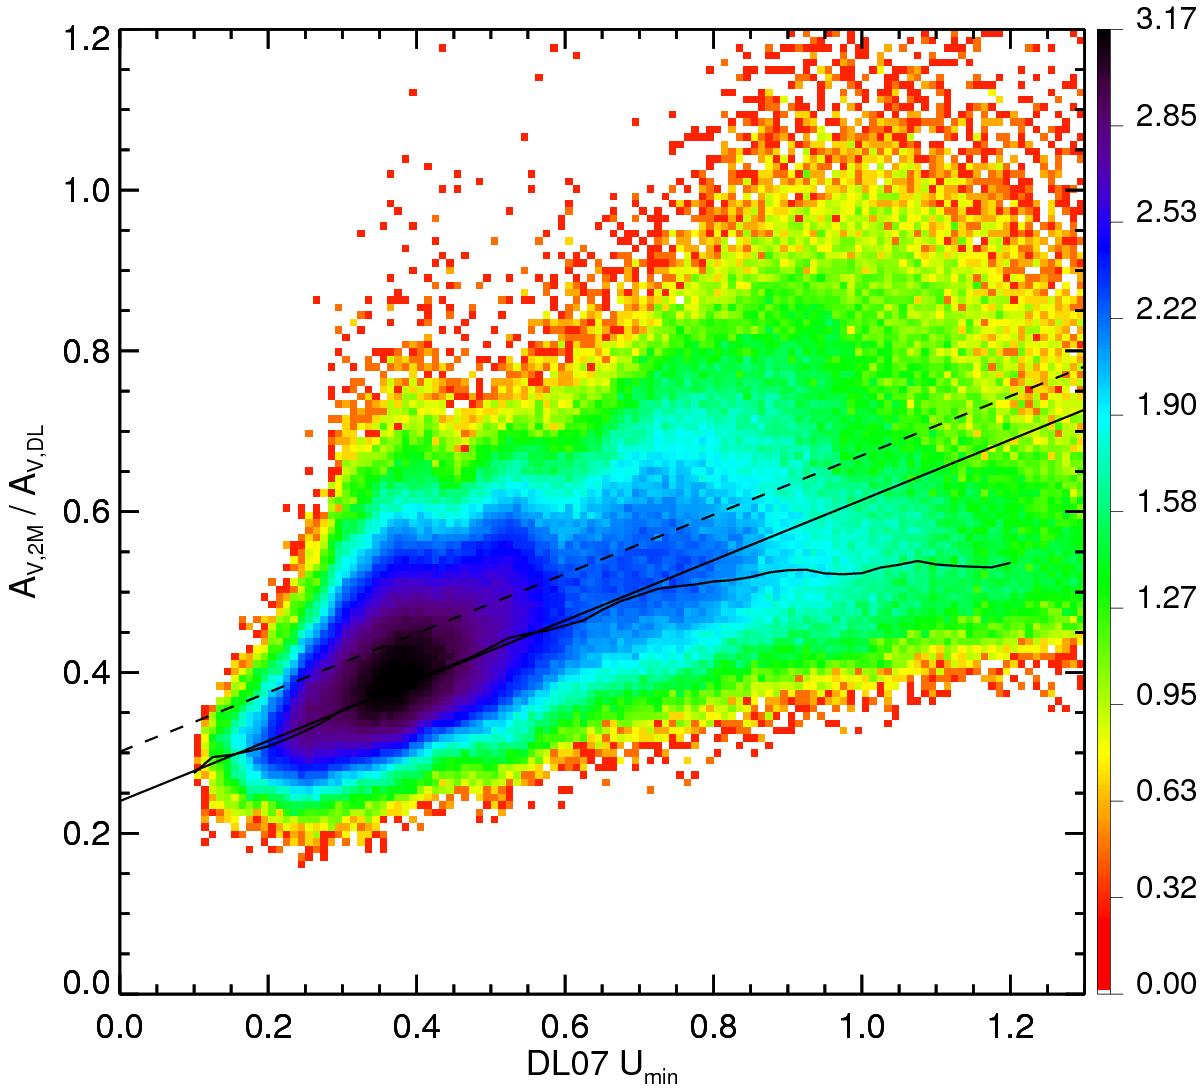
Renormalization of the DL AV values in molecular clouds. Pixels from the five molecular complexes with 1 <AV,2M< 5 are included here. Colours encode the logarithm of the density of points (see Fig. 5). For each Umin value, the solid curve corresponds to the best fit slope of theAV,DL versus AV,2M values. The straight solid line corresponds to a fit to the solid curve in the 0.2 <Umin< 1.0 range, where each Umin is given a weight proportional to the number of pixels that have this value in the clouds. The straight solid line provides the AV,RC renormalization, and the dashed line that derived from the QSO analysis.
Current usage metrics show cumulative count of Article Views (full-text article views including HTML views, PDF and ePub downloads, according to the available data) and Abstracts Views on Vision4Press platform.
Data correspond to usage on the plateform after 2015. The current usage metrics is available 48-96 hours after online publication and is updated daily on week days.
Initial download of the metrics may take a while.