Free Access
Fig. 15
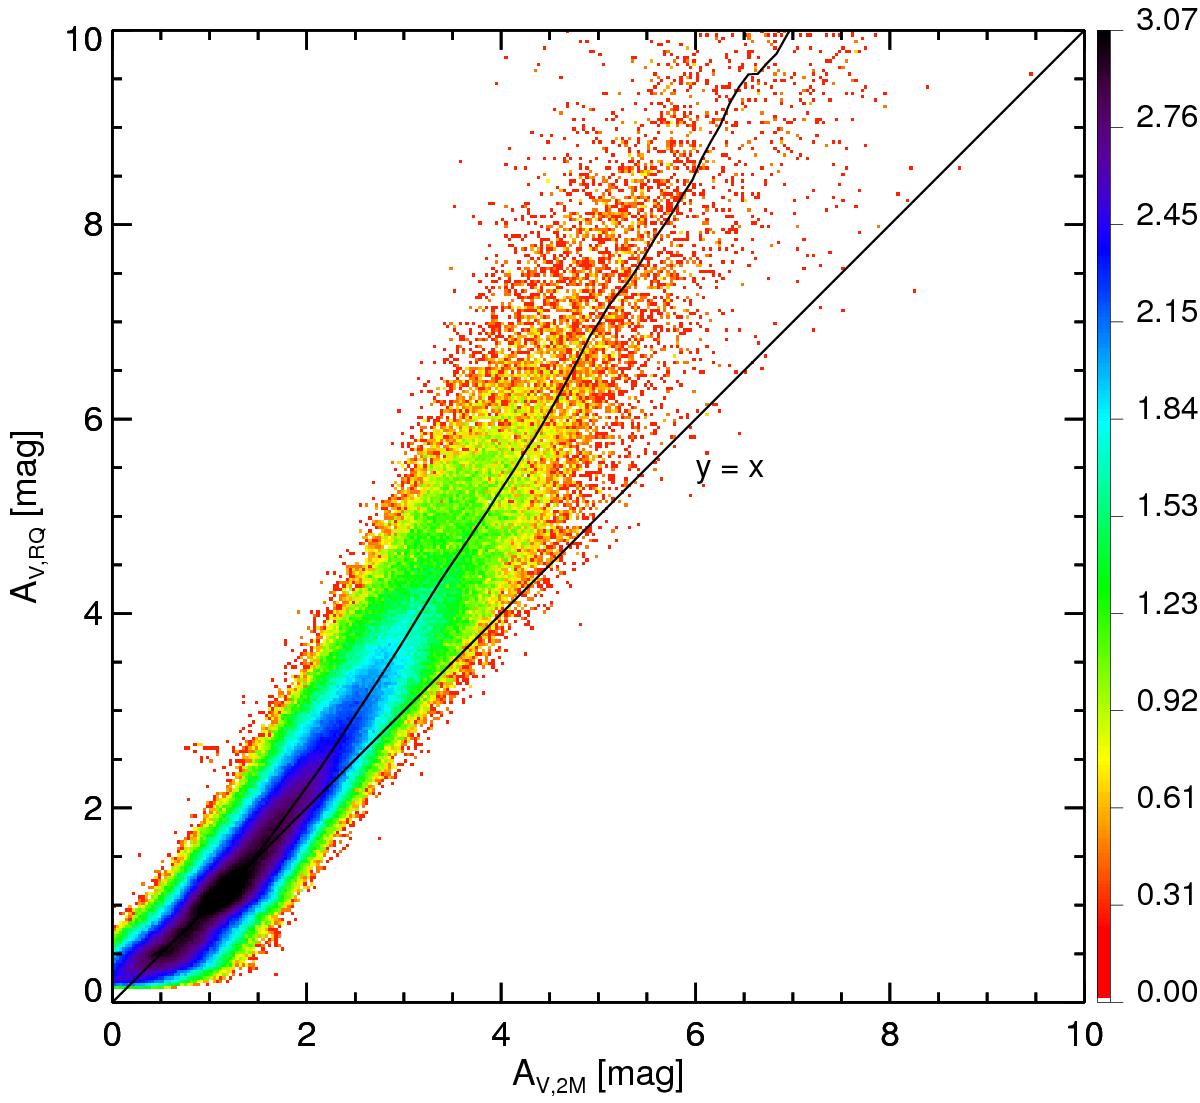
Comparison of the renormalized AV,RQ and 2MASS AV,2M estimates. The individual pixels of the Cepheus, Chamaeleon, Ophiuchus, Orion, and Taurus clouds are combined. Colour corresponds to the logarithm of the density of points (see Fig. 5). The diagonal line corresponds to y = x, and the curve to the mean value.
Current usage metrics show cumulative count of Article Views (full-text article views including HTML views, PDF and ePub downloads, according to the available data) and Abstracts Views on Vision4Press platform.
Data correspond to usage on the plateform after 2015. The current usage metrics is available 48-96 hours after online publication and is updated daily on week days.
Initial download of the metrics may take a while.