Free Access
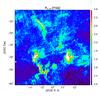
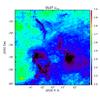
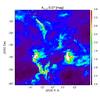
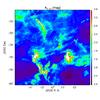
Fig. 13
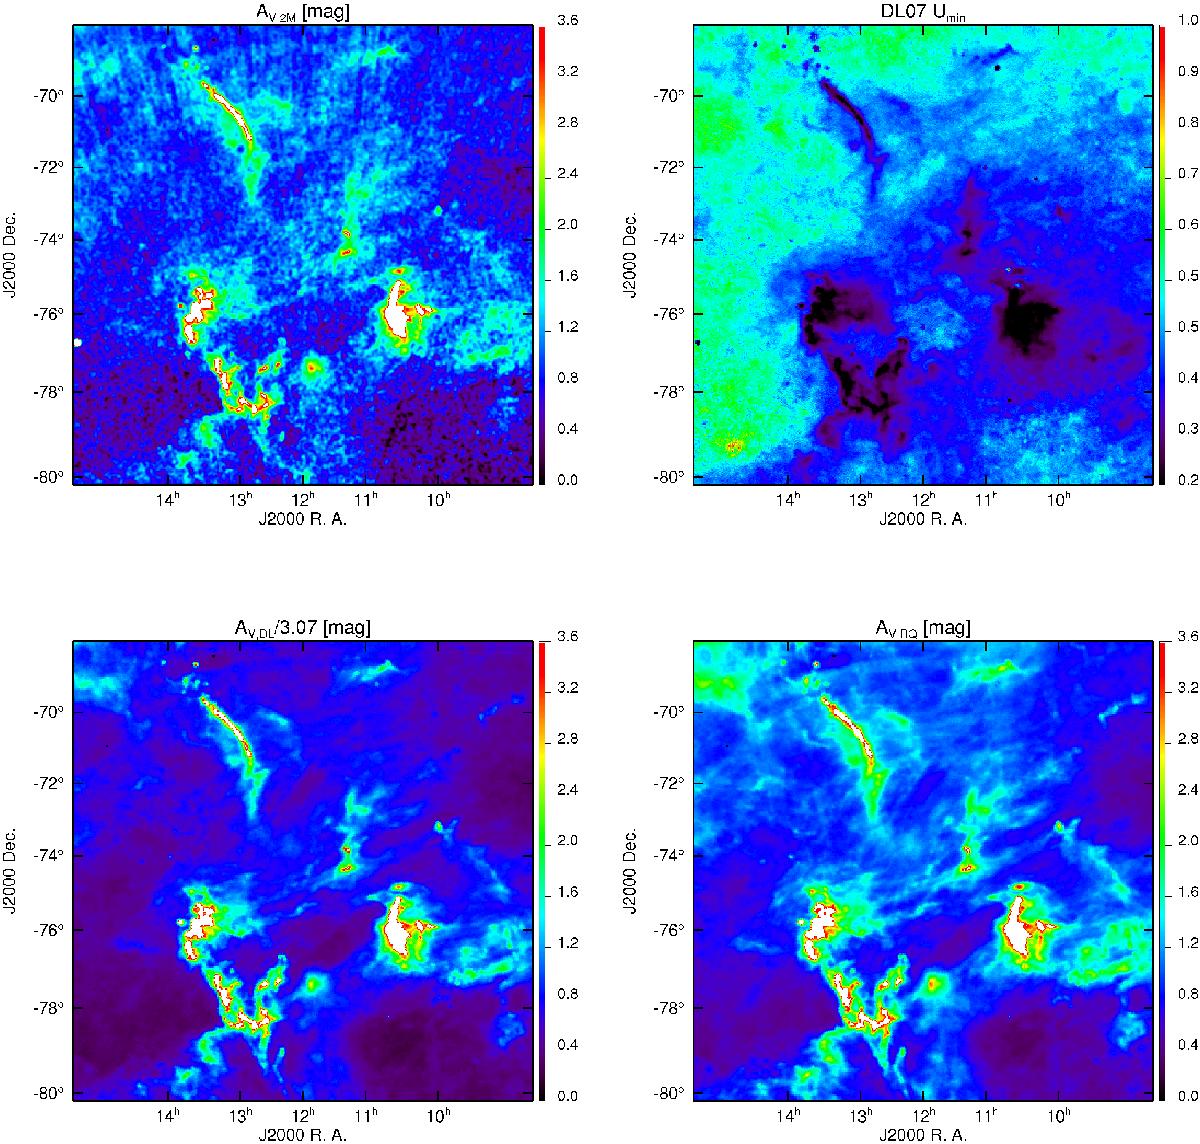
2MASS and DL estimates in the Chamaeleon cloud region. The top row shows the (background corrected) 2MASS AV,2M map (left) and the DL Umin map (right). The bottom row shows the DLAV,DL estimate divided by 3.07 (left), and the renormalized model AV,RQ estimates (right). (See Sect. 8.2 for a derivation of the 3.07 factor)
This figure is made of several images, please see below:
Current usage metrics show cumulative count of Article Views (full-text article views including HTML views, PDF and ePub downloads, according to the available data) and Abstracts Views on Vision4Press platform.
Data correspond to usage on the plateform after 2015. The current usage metrics is available 48-96 hours after online publication and is updated daily on week days.
Initial download of the metrics may take a while.