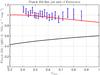
Fig. 12
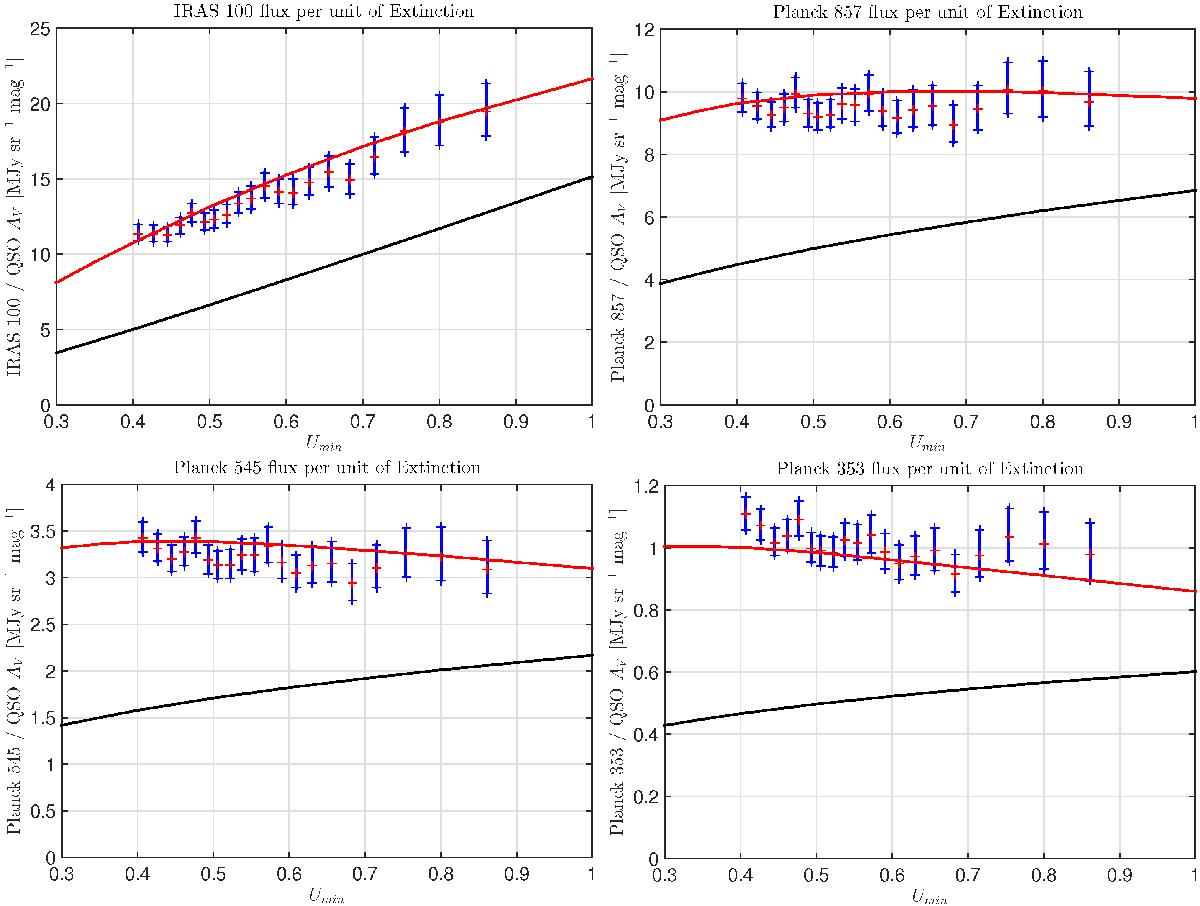
Specific intensities per unit of optical extinction derived from a linear fit between the dust emission maps andAV,QSO are plotted with red crosses and error bars in blue versus the fitted parameter Umin. The top row corresponds to IRAS 100 (left) and Planck 857 (right) and the bottom row to Planck 545 (left) and Planck 353 (right). The DL model values are plotted in black and the renormalized model in red. This plot shows that a Umin-dependent renormalization brings the DL model into agreement with the IRAS and Planck data.
Current usage metrics show cumulative count of Article Views (full-text article views including HTML views, PDF and ePub downloads, according to the available data) and Abstracts Views on Vision4Press platform.
Data correspond to usage on the plateform after 2015. The current usage metrics is available 48-96 hours after online publication and is updated daily on week days.
Initial download of the metrics may take a while.