Fig. 10
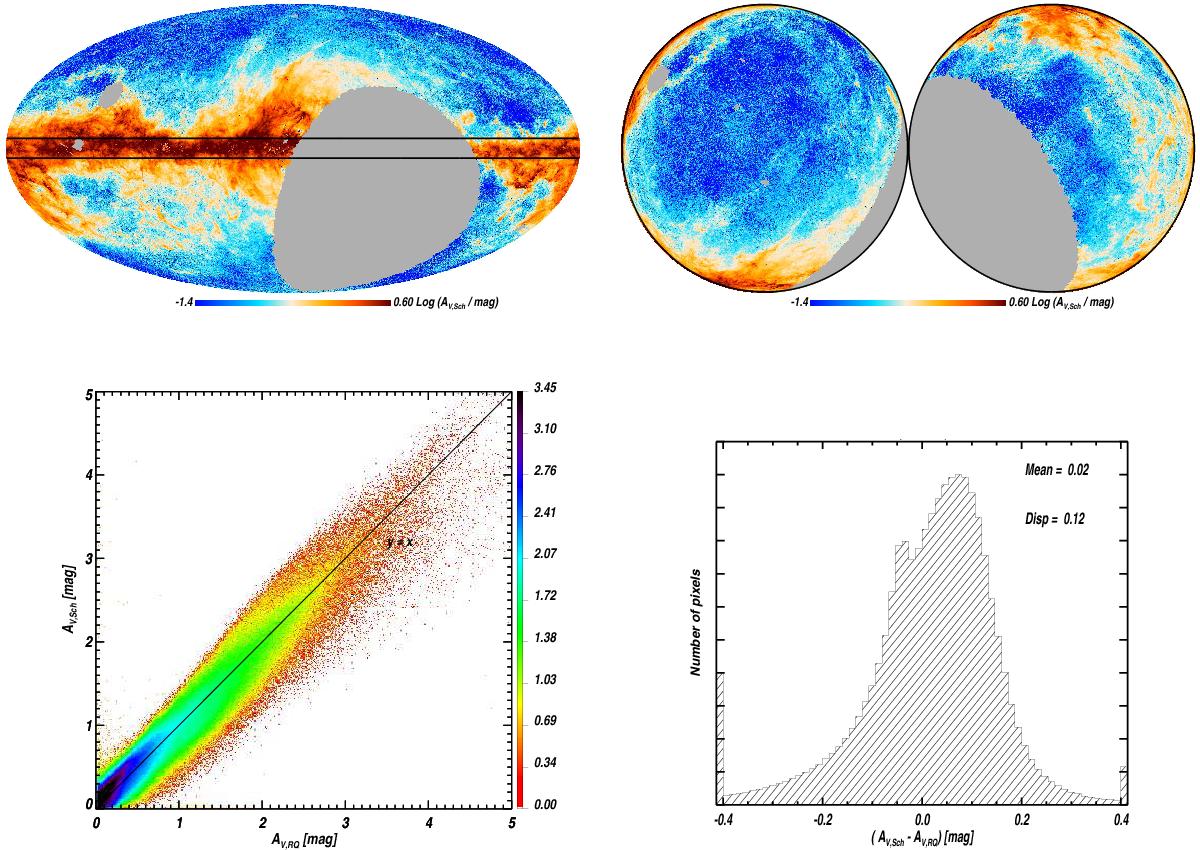
Comparison between the renormalized DL AV estimates (AV,RQ), and those derived from optical stellar observations (AV,Sch). The top row shows the AV maps derived from optical stellar observations. The b = ± 5° lines have been added for reference. The bottom row left panel compares the renormalized AV,RQ estimates with those derived from optical stellar observations AV,Sch in the | b | > 5° sky. The agreement of these independent AV estimates is a successful test of our empirical renormalization. The bottom row right panel show the histogram of the difference of the two AV estimates, also in the | b | > 5° sky.
Current usage metrics show cumulative count of Article Views (full-text article views including HTML views, PDF and ePub downloads, according to the available data) and Abstracts Views on Vision4Press platform.
Data correspond to usage on the plateform after 2015. The current usage metrics is available 48-96 hours after online publication and is updated daily on week days.
Initial download of the metrics may take a while.