Fig. 1
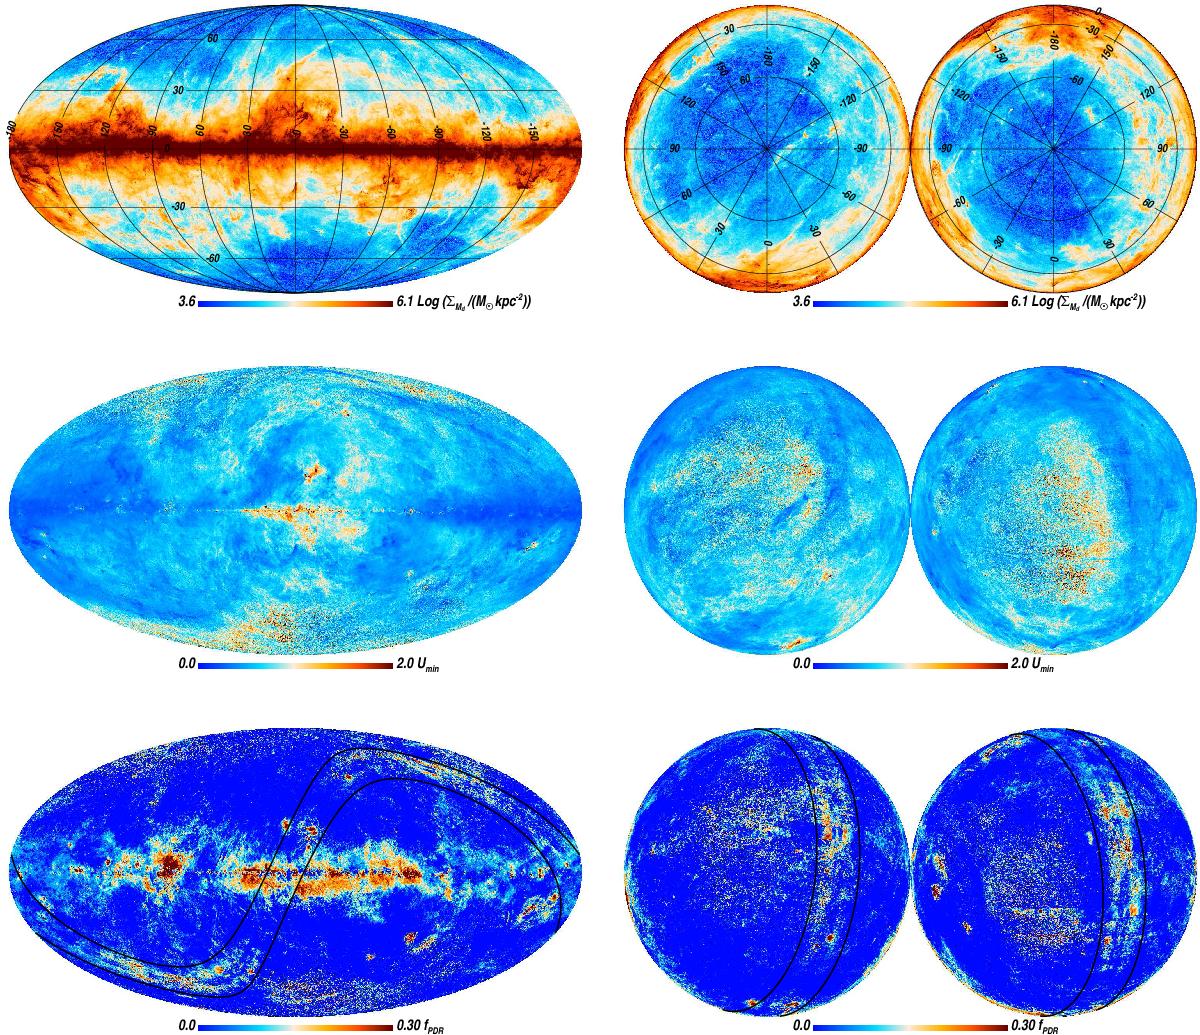
DL fitted parameter maps. The top row corresponds to the dust mass surface density, ΣMd, the middle row to the starlight intensity heating the bulk of the dust, Umin, and the bottom row to the fraction of dust luminosity emitted by dust heated with high stellar intensities, fPDR. The left column corresponds to a Mollweide projection of the sky in Galactic coordinates, and the centre and right columns correspond to orthographic projections of the southern and northern hemispheres centred on the corresponding Galactic poles. A Galactic coordinate grid is plotted in the maps of the first row. Lines of ecliptic latitude at ± 10° are plotted in the maps of the bottom row.
Current usage metrics show cumulative count of Article Views (full-text article views including HTML views, PDF and ePub downloads, according to the available data) and Abstracts Views on Vision4Press platform.
Data correspond to usage on the plateform after 2015. The current usage metrics is available 48-96 hours after online publication and is updated daily on week days.
Initial download of the metrics may take a while.