Free Access
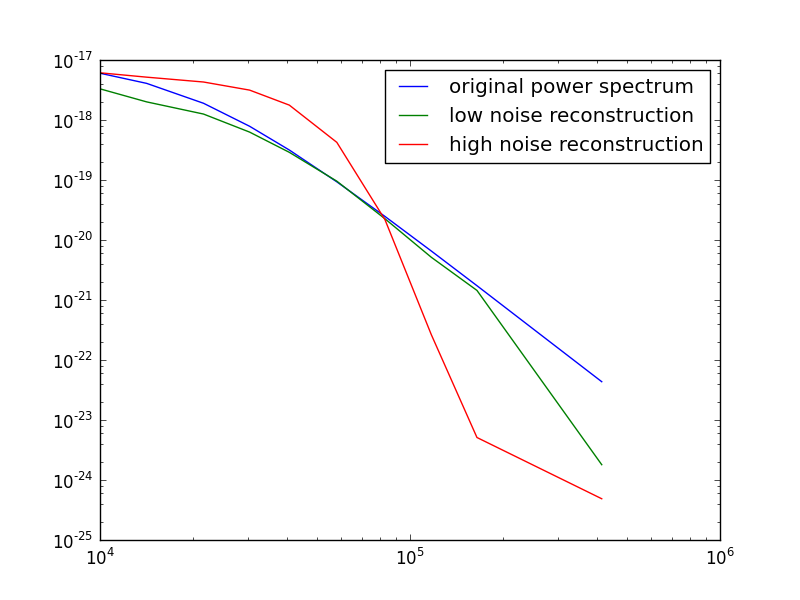
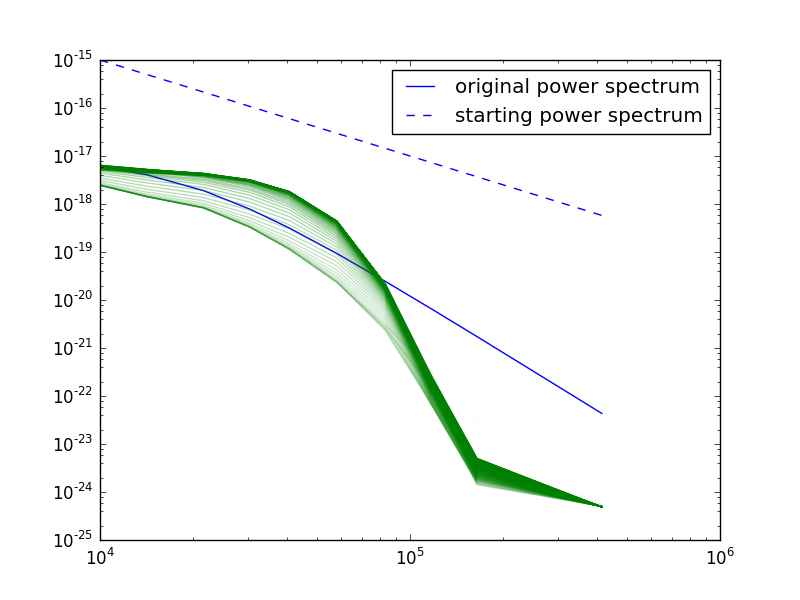
Fig. 9
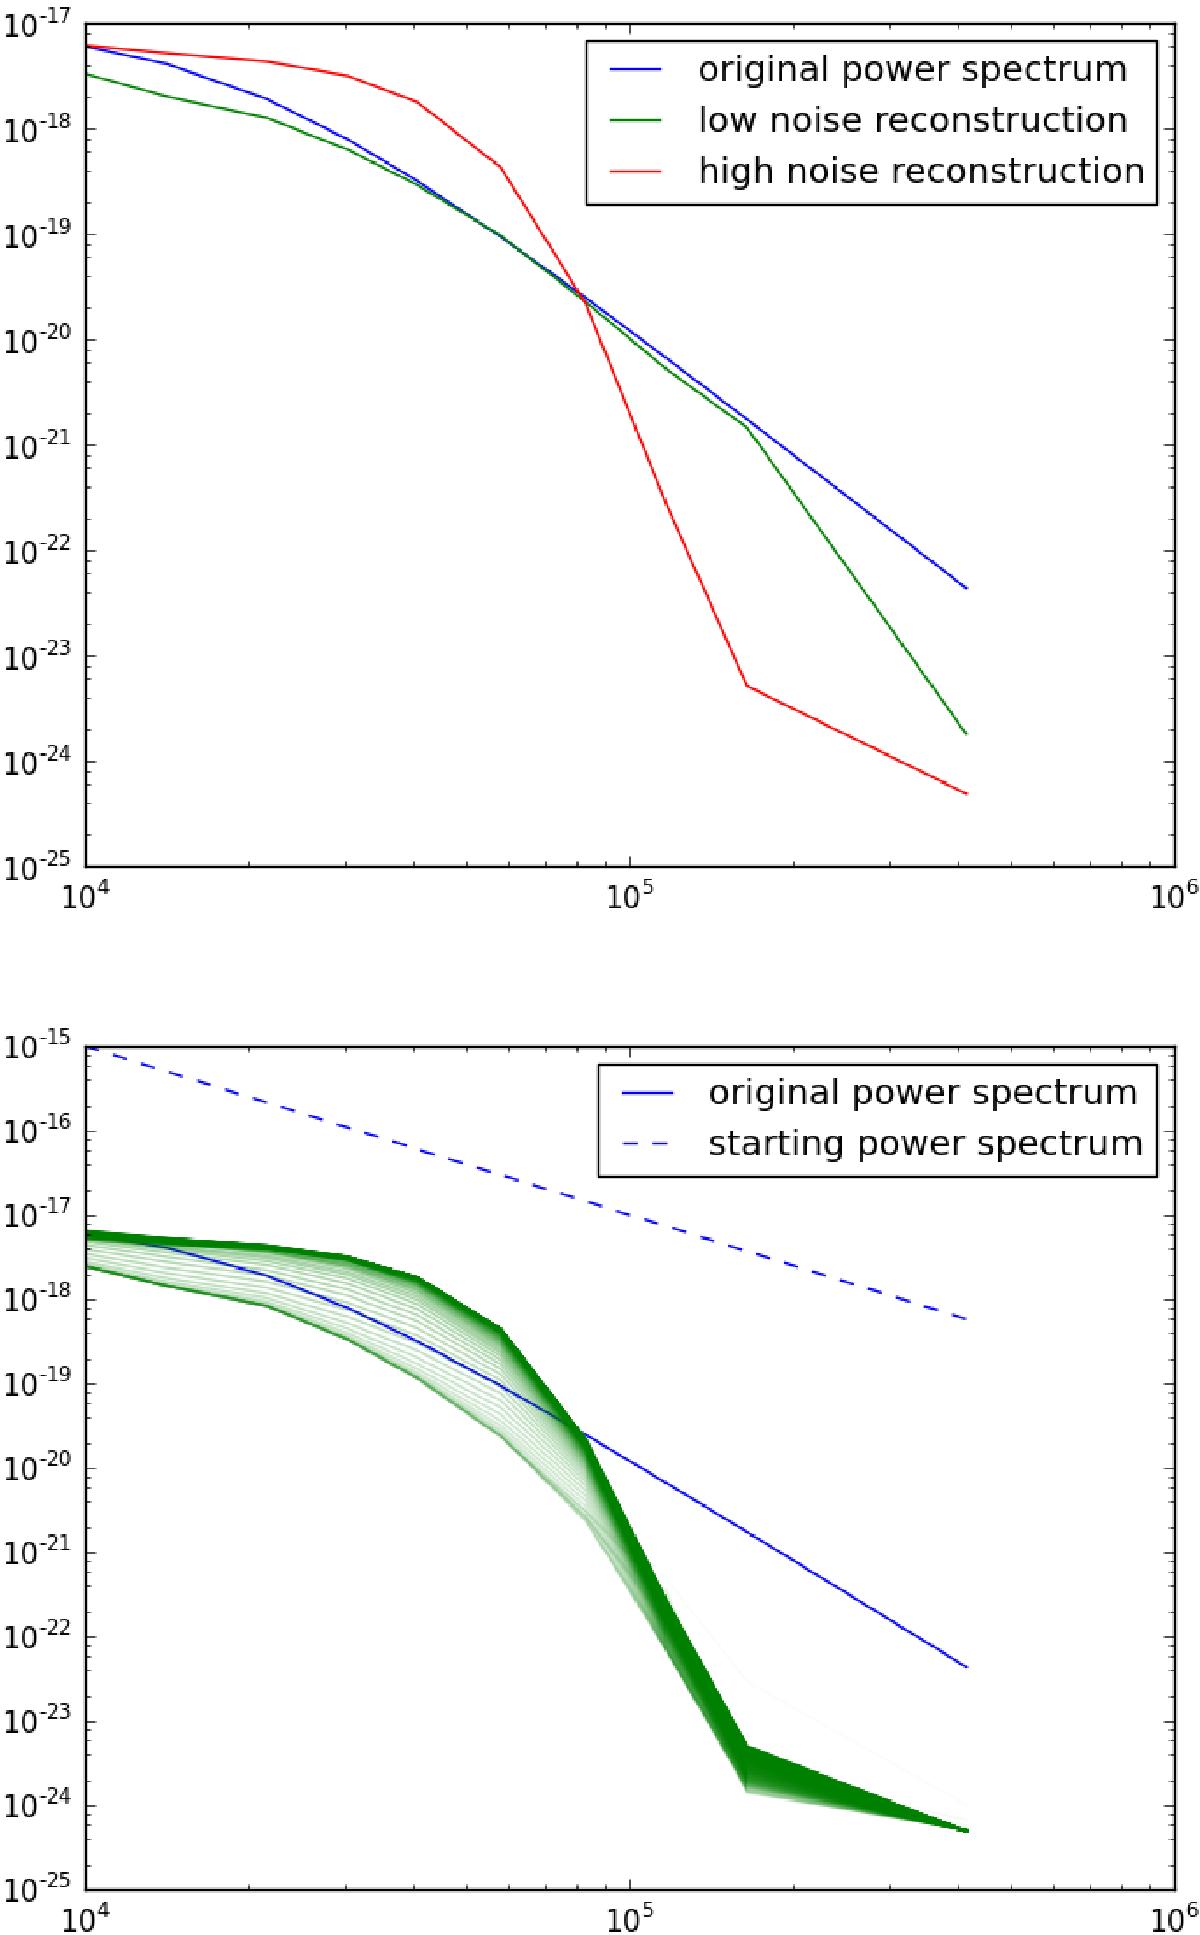
First panel: power spectrum reconstruction for the simulated low-noise and high-noise observations of Sect. 3.1. Second panel: evolution of the high-noise power spectrum reconstruction over 80 iterations. The iteration process is indicated from transparent to full green.
This figure is made of several images, please see below:
Current usage metrics show cumulative count of Article Views (full-text article views including HTML views, PDF and ePub downloads, according to the available data) and Abstracts Views on Vision4Press platform.
Data correspond to usage on the plateform after 2015. The current usage metrics is available 48-96 hours after online publication and is updated daily on week days.
Initial download of the metrics may take a while.