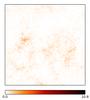
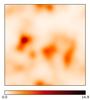
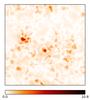
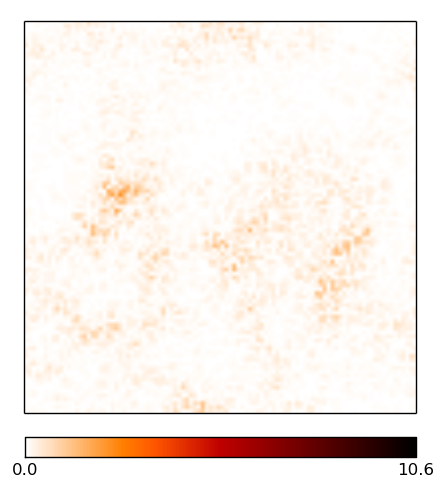
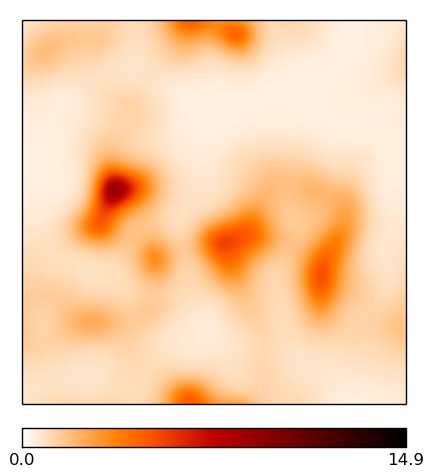
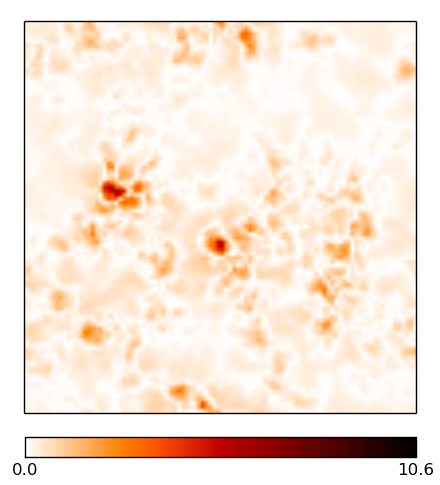
Fig. 4
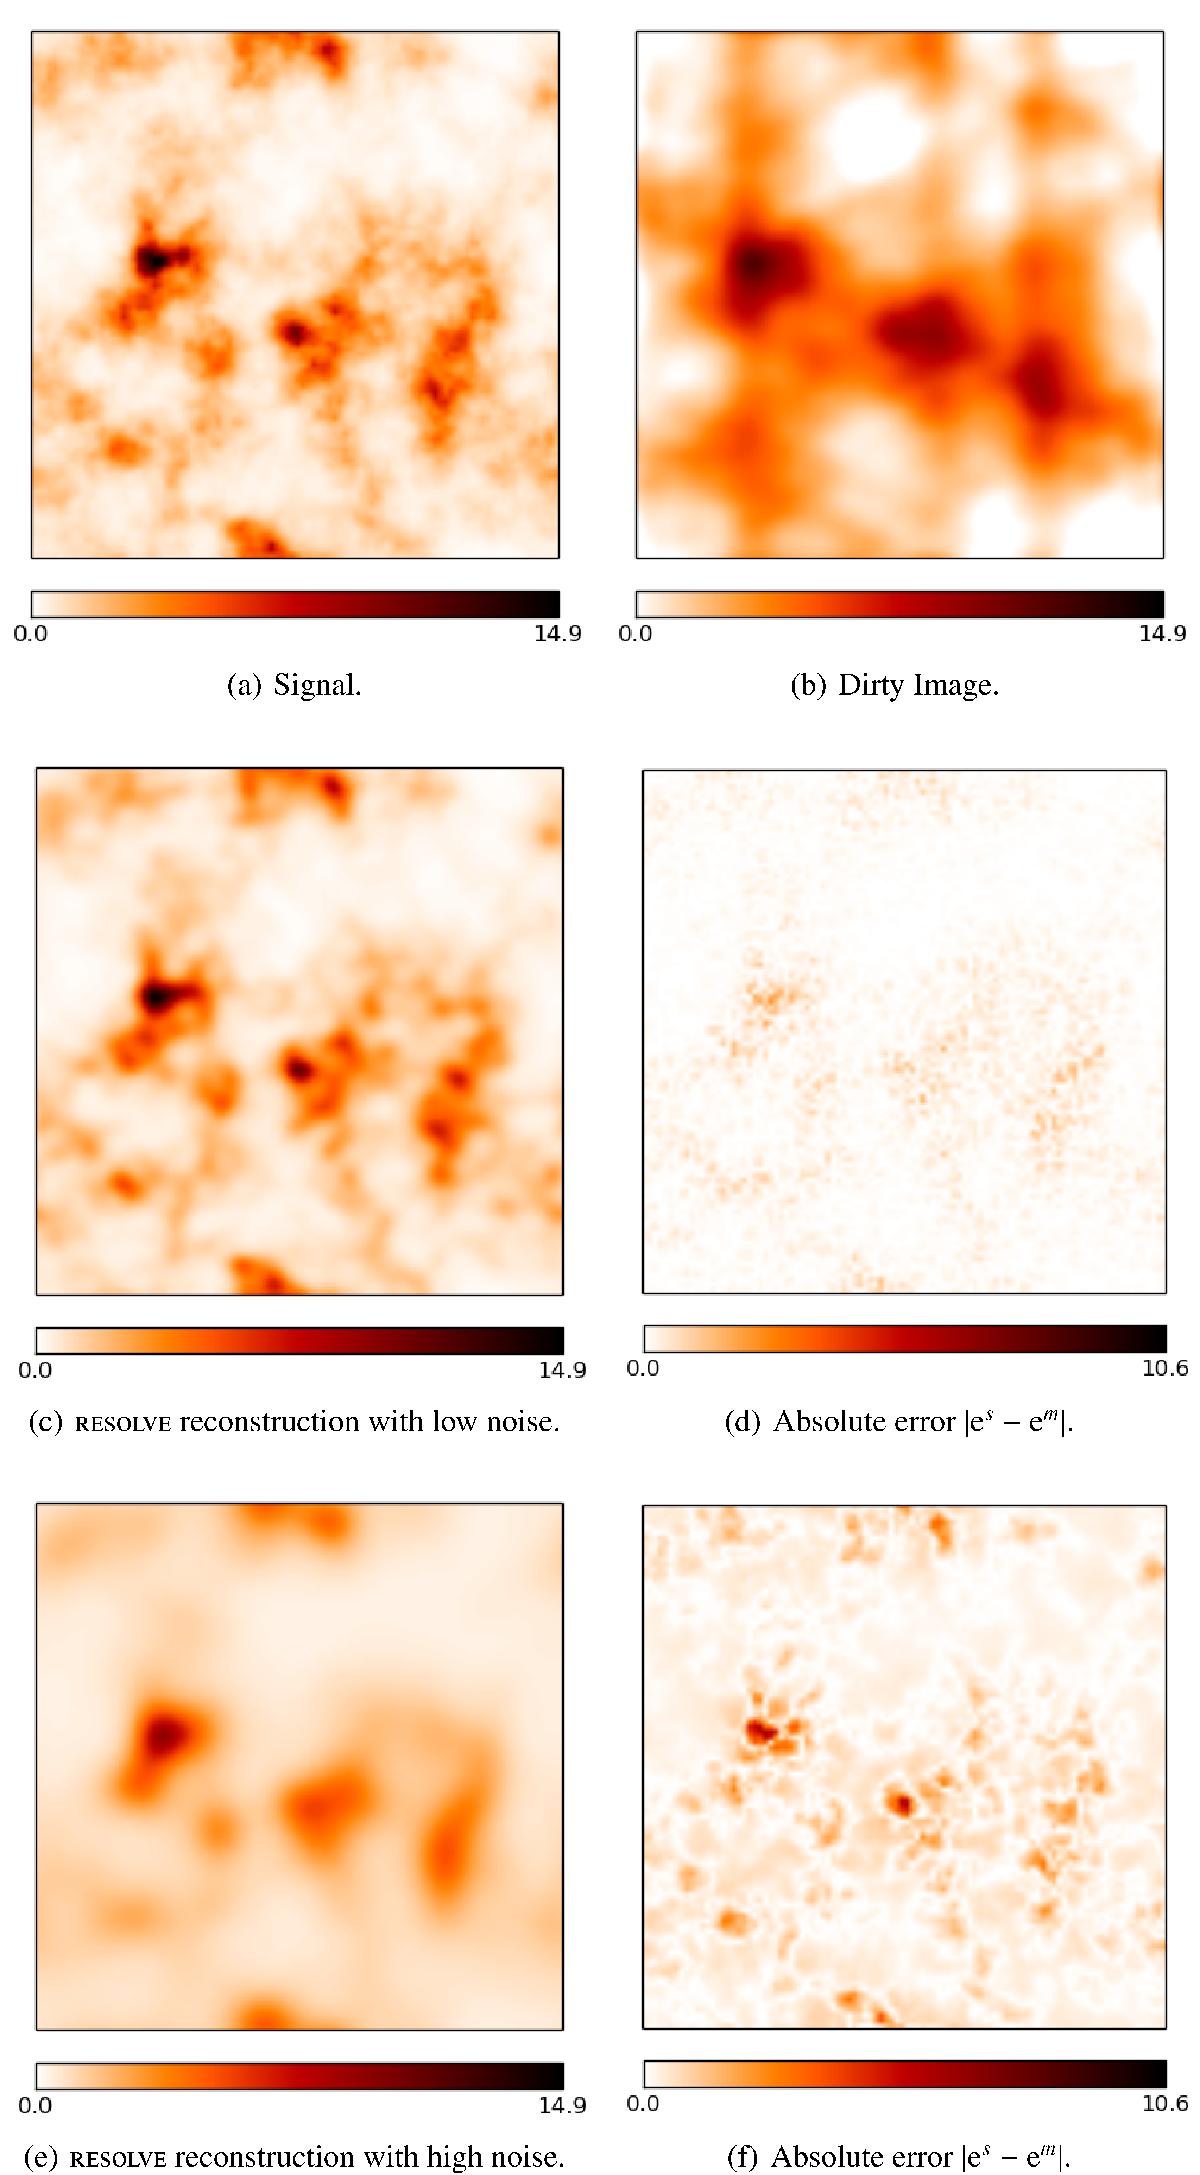
Reconstruction of a log-normal signal field, observed with a sparse uv-coverage from a VLA-A-configuration and different noise levels. The images are 1002 pixels large, the pixel size corresponds to roughly 0.2 arcsec. The brightness units are in Jy/px. The ridge-like structures in the difference maps simply stem from taking the absolute value and mark zero-crossings between positive and negative errors. First row left: signal field. First row right: dirty map. Second row left resolve reconstruction with low noise. Second row right: absolute per-pixel difference between the signal and the resolve reconstruction with low noise. Third row left: resolve reconstruction with high noise. Third row right: absolute per-pixel difference between the signal and the resolve reconstruction with high noise.
Current usage metrics show cumulative count of Article Views (full-text article views including HTML views, PDF and ePub downloads, according to the available data) and Abstracts Views on Vision4Press platform.
Data correspond to usage on the plateform after 2015. The current usage metrics is available 48-96 hours after online publication and is updated daily on week days.
Initial download of the metrics may take a while.