Fig. 3
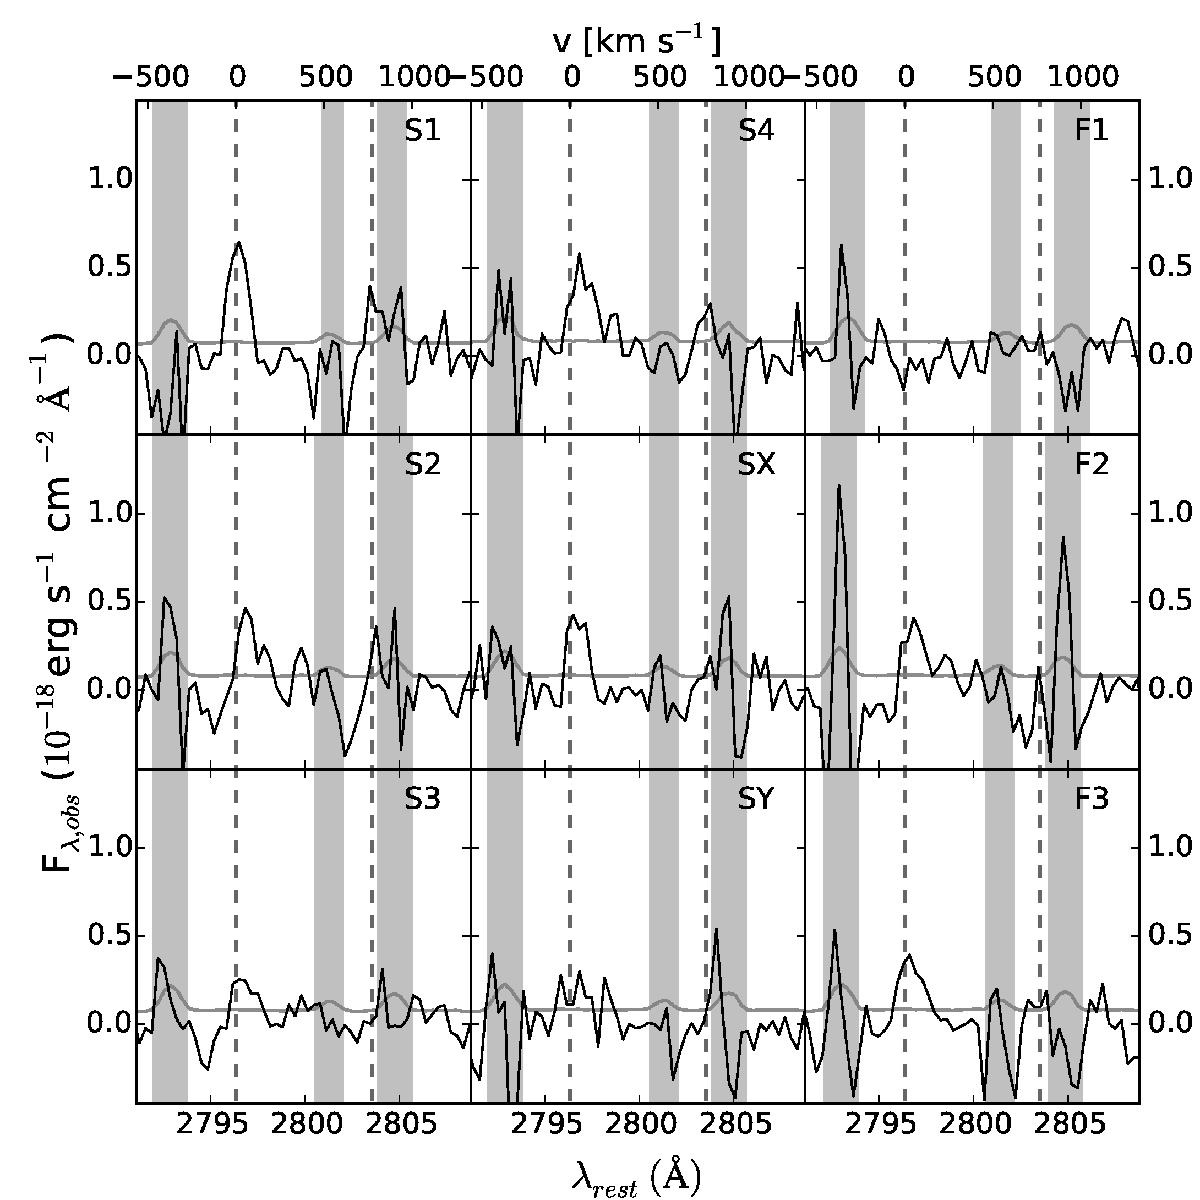
Spectra around the Mg ii line at all observed and model-predicted SN positions (S1–4, SX, SY), and at three star-forming clumps (F1–3). The black solid lines show the continuum-subtracted spectra, which have been shifted to their rest frame using the [O ii] doublet to determine the redshift. The vertical dashed lines are at the wavelengths of the Mg ii doublet, the grey solid lines represent the errors, and grey vertical bands mark wavelengths with significant sky emission. The axis on the top shows the relative velocity of Mg iiλ 2796 Å with respect to [O ii].
Current usage metrics show cumulative count of Article Views (full-text article views including HTML views, PDF and ePub downloads, according to the available data) and Abstracts Views on Vision4Press platform.
Data correspond to usage on the plateform after 2015. The current usage metrics is available 48-96 hours after online publication and is updated daily on week days.
Initial download of the metrics may take a while.