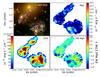
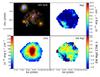
Fig. 2

Two western images (left), and the eastern image (right) of Sp1149. The two figures are divided into four panels; top left: HST RGB image with white, yellow, and red circles at the positions of SN Refsdal, the centre of the galaxy, and four star-forming clumps of Sp1149, respectively. Top right: Mg ii emission line flux; bottom left: [O ii] emisson-line flux; bottom right: equivalent width (EW) of Mg iiλ2796 Å, where a negative EW represents emission. The circles are at the same positions as the circles in the top left panel. The EW have been corrected for stellar absorption (0.5 Å, see Guseva et al. 2013), and, for displaying purposes, the MUSE maps have been smoothed over a box of 3 × 3 pixels.
Current usage metrics show cumulative count of Article Views (full-text article views including HTML views, PDF and ePub downloads, according to the available data) and Abstracts Views on Vision4Press platform.
Data correspond to usage on the plateform after 2015. The current usage metrics is available 48-96 hours after online publication and is updated daily on week days.
Initial download of the metrics may take a while.