Free Access
Fig. 6
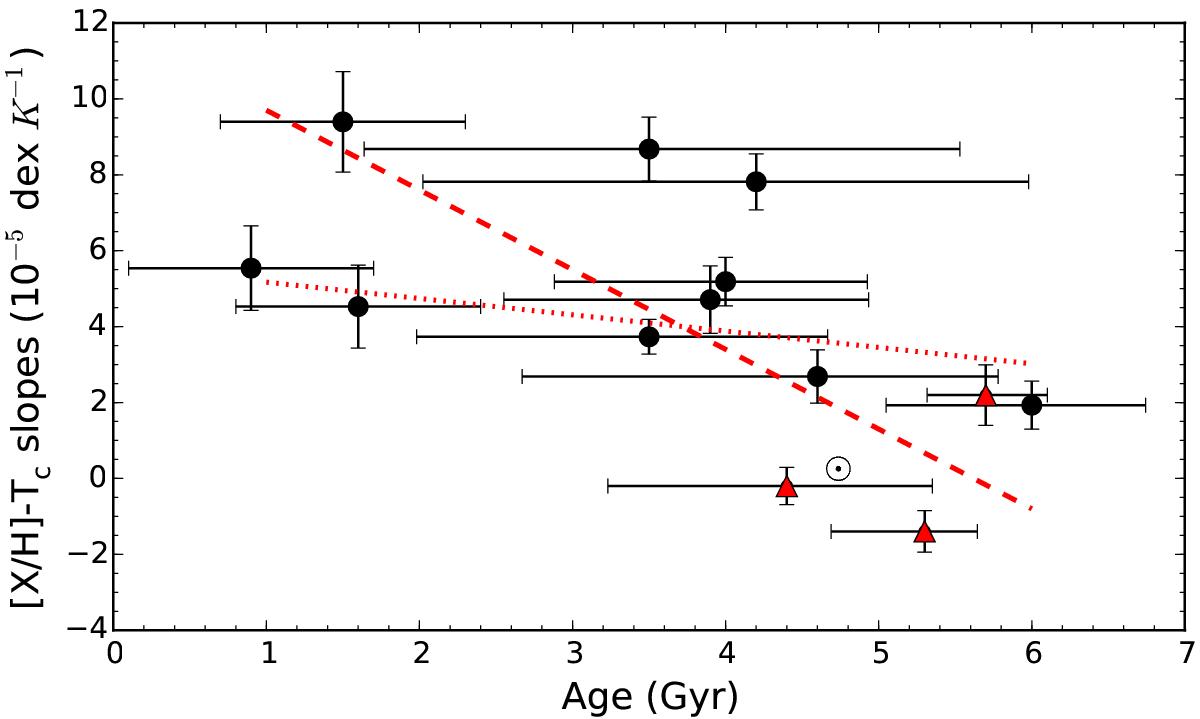
[X/H]-Tc slopes as a function of stellar ages. The red filled triangles are the planet-hosting stars. The red dashed line is the result of the linear fit of the data set shown in the plot, while the red dotted line represents the [X/H]-Tc slopes vs. age relation found by Nissen (2015).
Current usage metrics show cumulative count of Article Views (full-text article views including HTML views, PDF and ePub downloads, according to the available data) and Abstracts Views on Vision4Press platform.
Data correspond to usage on the plateform after 2015. The current usage metrics is available 48-96 hours after online publication and is updated daily on week days.
Initial download of the metrics may take a while.