Fig. 7
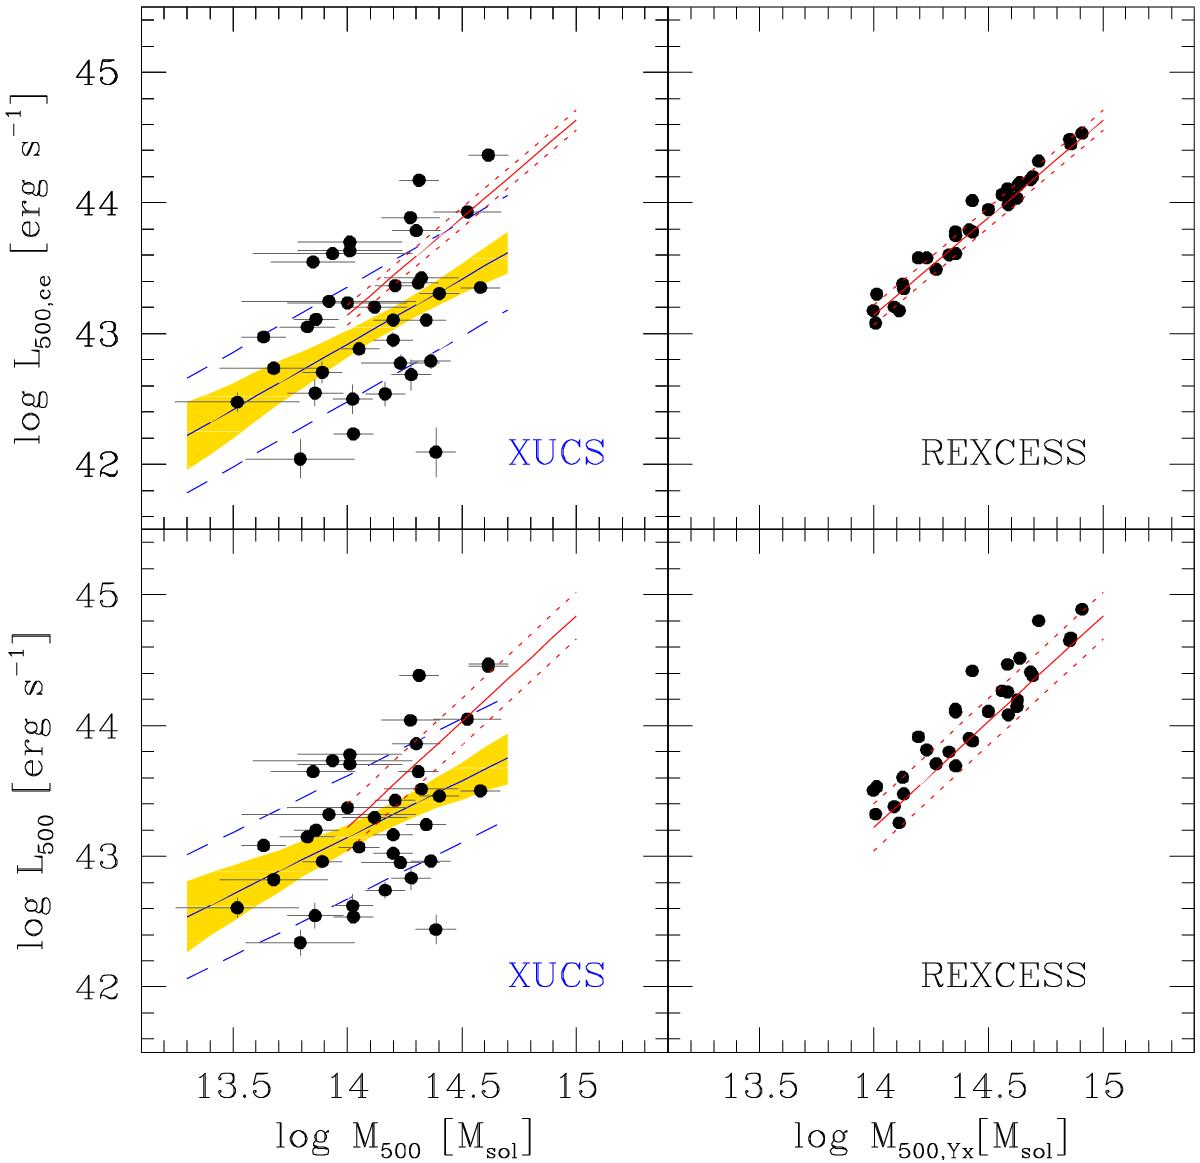
X-ray luminosity ([0.5−2] keV band) vs. Mass. Top panels: core-excised. Bottom panels: non-core excised. Left-hand panels: our (XUCS) sample. Right-hand panels: REXCESS sample. The solid (red) and dotted lines are the REXCESS Malmquist-bias corrected mean and estimated scatter. The solid blue line surronded by a yellow shading indicates our fit to our data. The shading indicates its 68% uncertainty and the dashed blue dashed lines indicate the fit model ± the intrinsic scatter.
Current usage metrics show cumulative count of Article Views (full-text article views including HTML views, PDF and ePub downloads, according to the available data) and Abstracts Views on Vision4Press platform.
Data correspond to usage on the plateform after 2015. The current usage metrics is available 48-96 hours after online publication and is updated daily on week days.
Initial download of the metrics may take a while.