Fig. 5
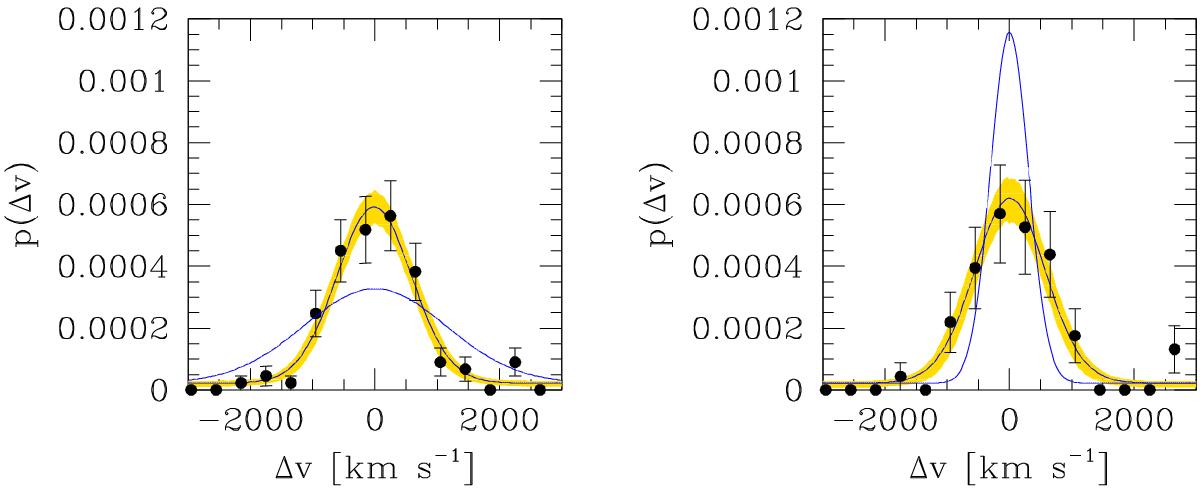
Velocity distribution of the galaxies in the clusters CL3013 (left-hand panel) and CL2007 (right-hand panel). The solid line is the mean model fitted to the individual galaxy data in the r − v plane, while the shading indicates the 68% uncertainty (highest posterior density interval). Points and approximated error bars are derived by ignoring the radial information, binning galaxies in velocity bins, and adopting approximated Poisson errors, as is commonly found in the literature. The blue curves shows the distribution appropriate for their observed X-ray luminosity (see Sect. 5.4 for details).
Current usage metrics show cumulative count of Article Views (full-text article views including HTML views, PDF and ePub downloads, according to the available data) and Abstracts Views on Vision4Press platform.
Data correspond to usage on the plateform after 2015. The current usage metrics is available 48-96 hours after online publication and is updated daily on week days.
Initial download of the metrics may take a while.