Fig. 3
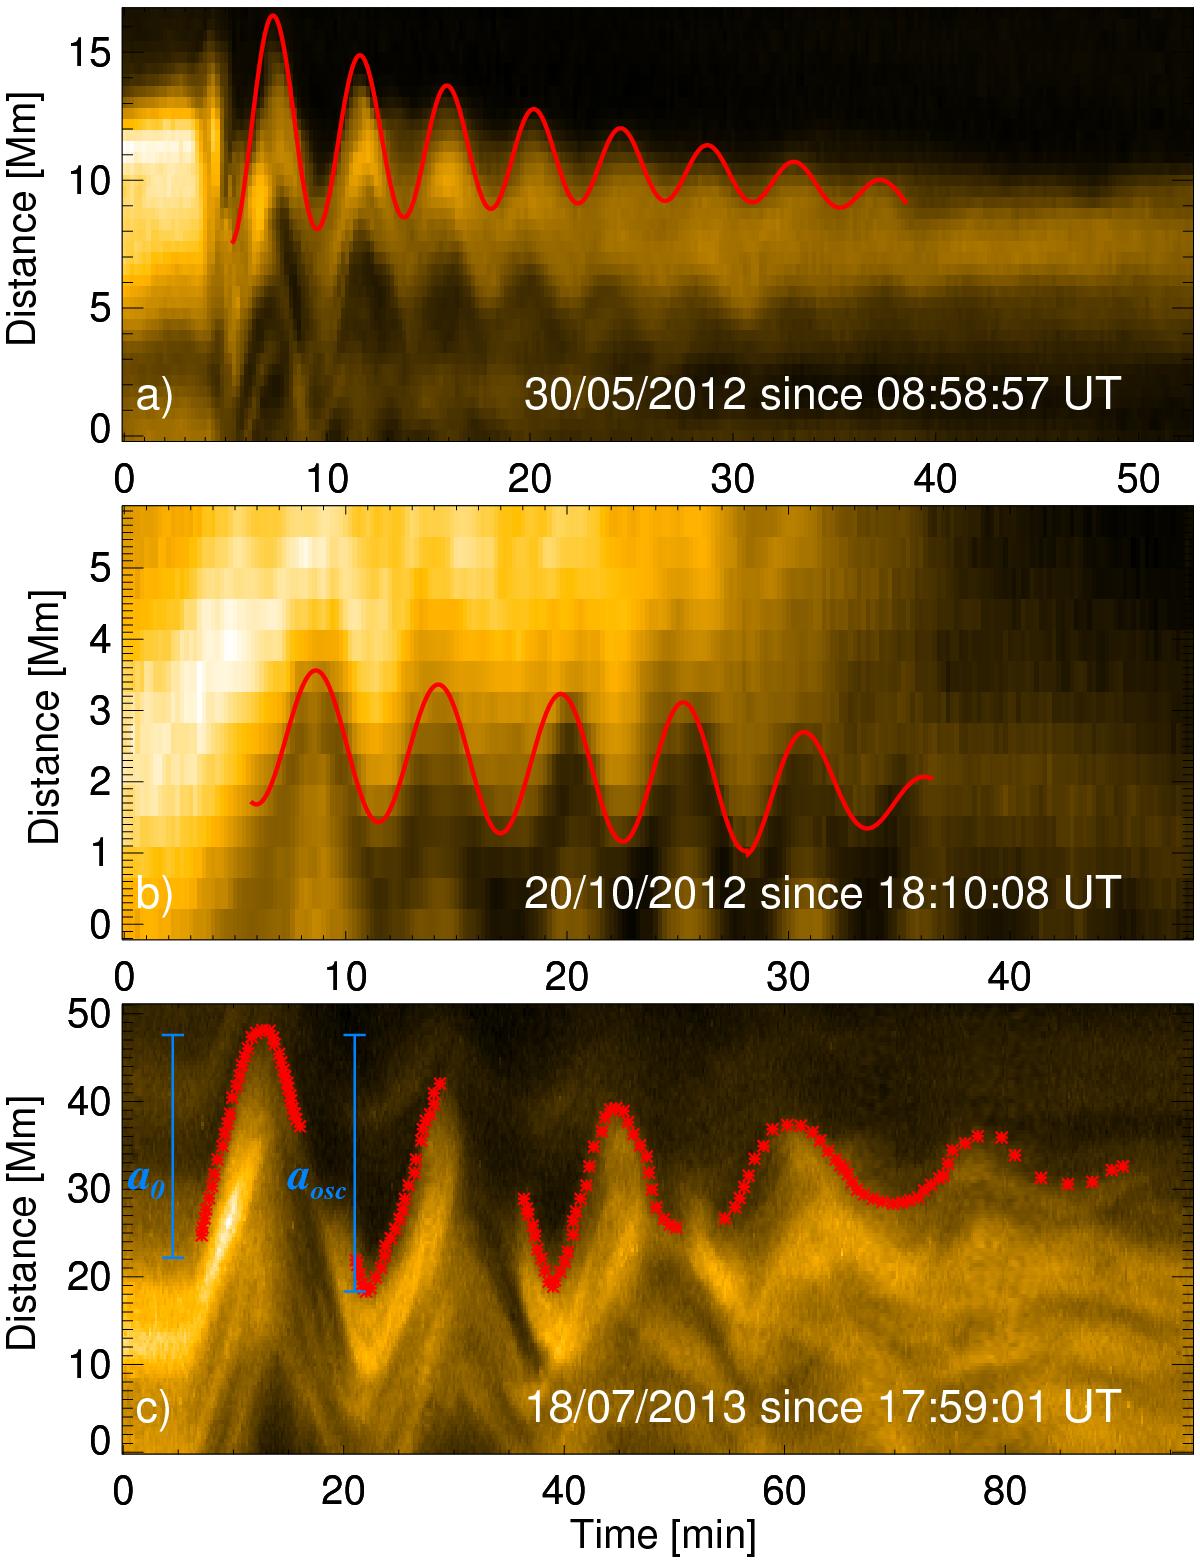
Three typical time distance maps, corresponding to loop 1 from event 32, loop 4 from event 40, and loop 2 from event 48. The fits correspond to the detrending polynomial added to the sinusoidal fit and multiplied by the exponential damping profile for panels a) and b). The red points in panel c) were taken by eye to map out the oscillation and used for the subsequent fitting. The vertical blue bars represent the measurement of the initial displacement (a0) and the initial oscillation amplitude (aosc) of the upper loop edge.
Current usage metrics show cumulative count of Article Views (full-text article views including HTML views, PDF and ePub downloads, according to the available data) and Abstracts Views on Vision4Press platform.
Data correspond to usage on the plateform after 2015. The current usage metrics is available 48-96 hours after online publication and is updated daily on week days.
Initial download of the metrics may take a while.