Fig. 2
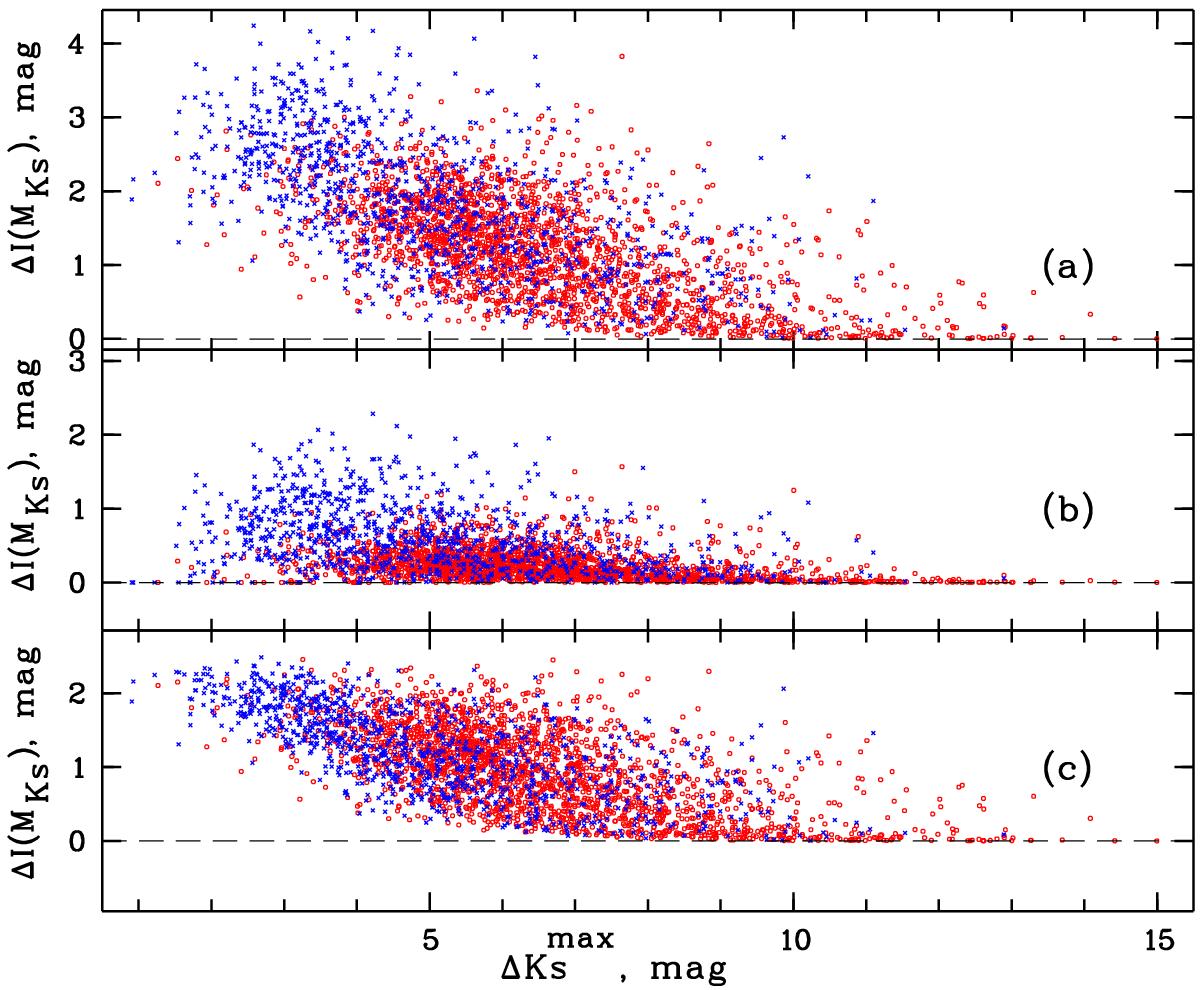
Relations between different points of the clusters’ luminosity profile vs. the maximum magnitude range ![]() . Panel a) shows the relation between the boundary values of the observed profile of integrated magnitudes Ibr(MKS) − Ifn(MKS), panel b) the fainter part of the profile I12(MKS) − Ifn(MKS), and panel c) its brighter part Ibr(MKS) − I12(MKS). Blue crosses indicate clusters with
. Panel a) shows the relation between the boundary values of the observed profile of integrated magnitudes Ibr(MKS) − Ifn(MKS), panel b) the fainter part of the profile I12(MKS) − Ifn(MKS), and panel c) its brighter part Ibr(MKS) − I12(MKS). Blue crosses indicate clusters with ![]() , and red circles clusters with
, and red circles clusters with ![]() .
.
Current usage metrics show cumulative count of Article Views (full-text article views including HTML views, PDF and ePub downloads, according to the available data) and Abstracts Views on Vision4Press platform.
Data correspond to usage on the plateform after 2015. The current usage metrics is available 48-96 hours after online publication and is updated daily on week days.
Initial download of the metrics may take a while.