Open Access
Fig. 8
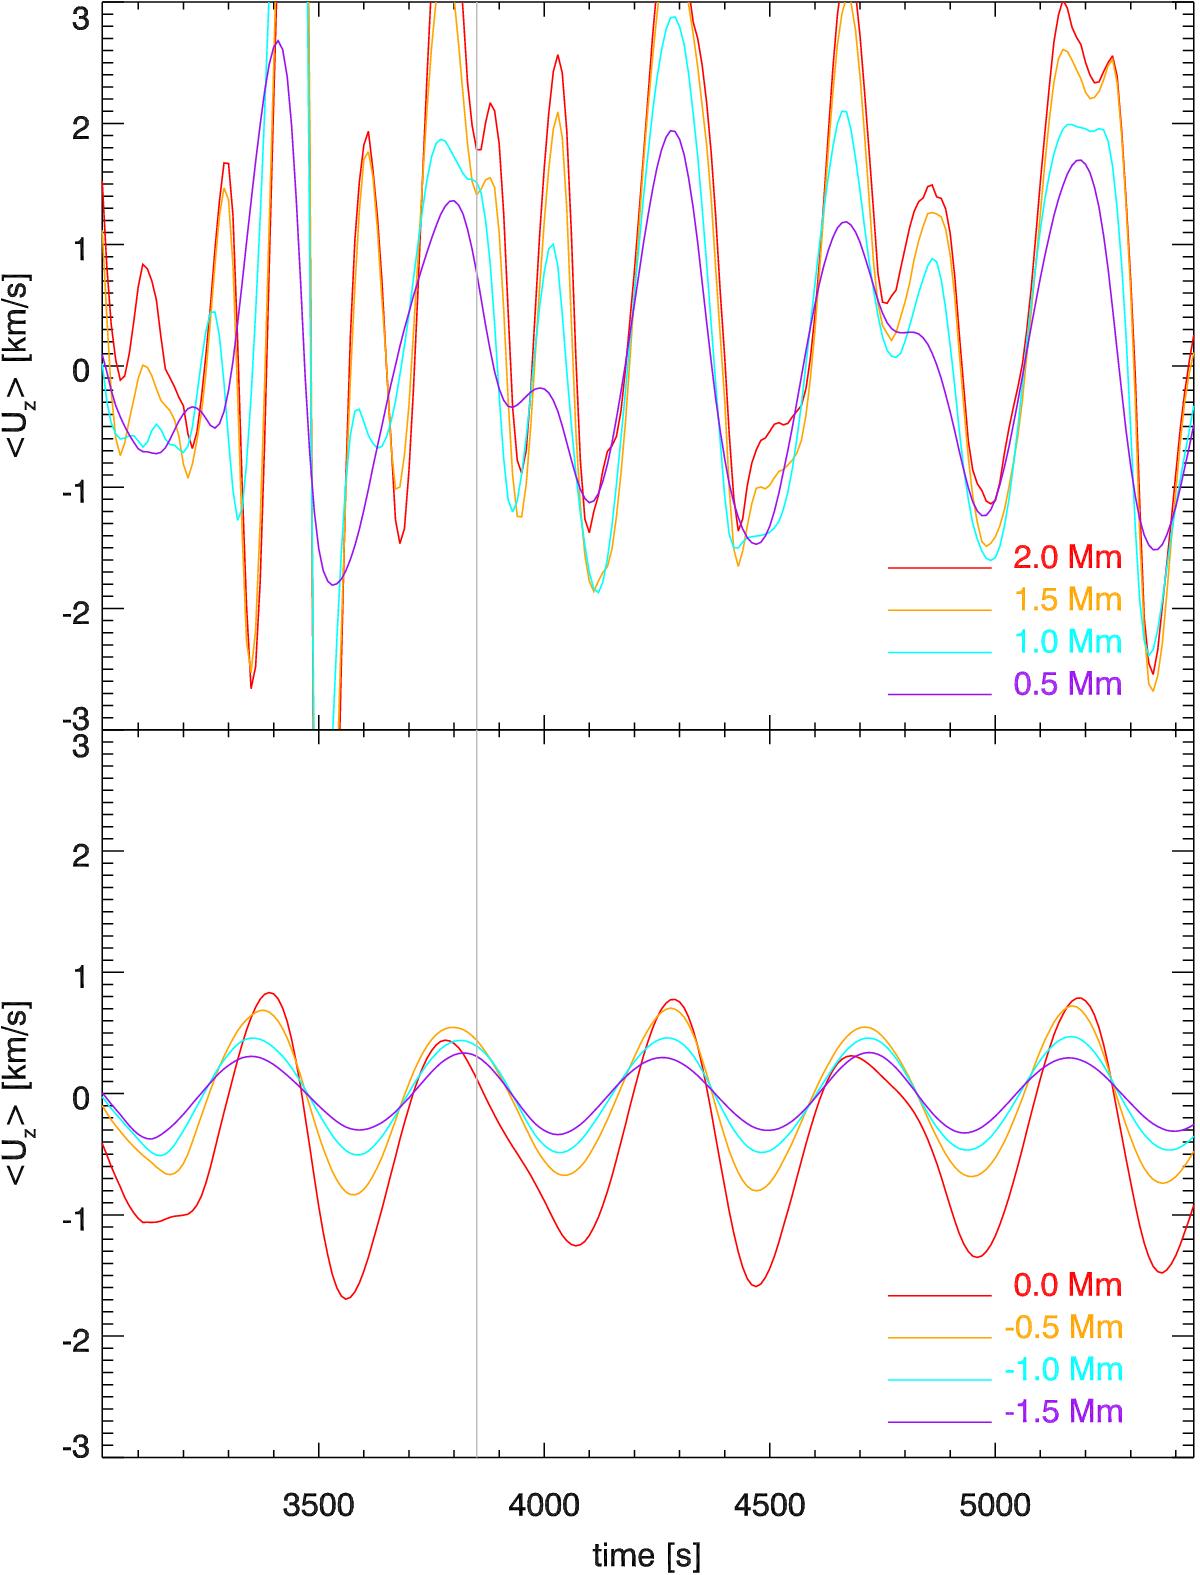
Horizontally averaged vertical velocity (positive is downflow) as function of time for eight heights (four in the upper panel and four in the lower panel, heights as given in the legend). The start of the published sequence of snapshots is indicated at t = 3850 s as a grey line.
Current usage metrics show cumulative count of Article Views (full-text article views including HTML views, PDF and ePub downloads, according to the available data) and Abstracts Views on Vision4Press platform.
Data correspond to usage on the plateform after 2015. The current usage metrics is available 48-96 hours after online publication and is updated daily on week days.
Initial download of the metrics may take a while.