Open Access
Fig. 3
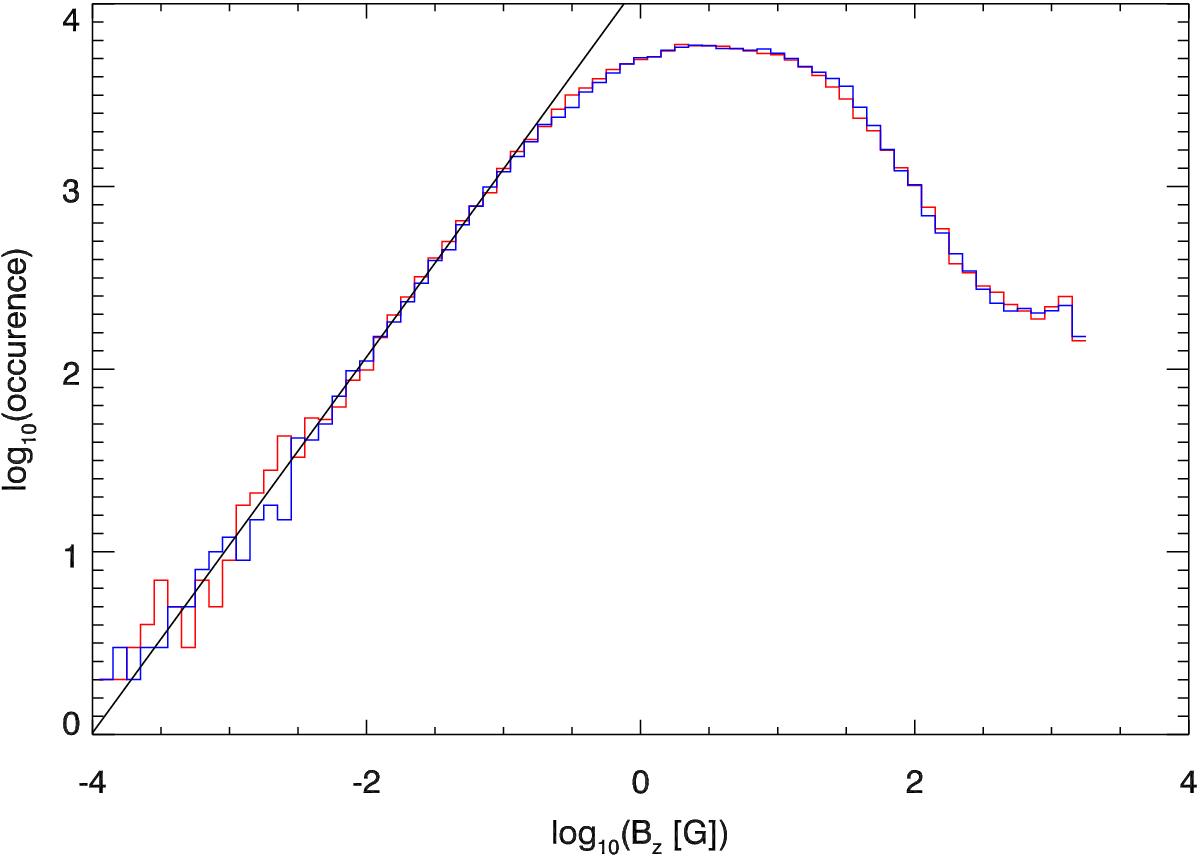
Histogram of the vertical magnetic field strength, Bz at z = 0 and t = 3850 s for positive Bz (red) and negative Bz (blue). The straight black line shows a fit to the field with a strength below 0.1 G. The slope is 1.03 in the log-log plot.
Current usage metrics show cumulative count of Article Views (full-text article views including HTML views, PDF and ePub downloads, according to the available data) and Abstracts Views on Vision4Press platform.
Data correspond to usage on the plateform after 2015. The current usage metrics is available 48-96 hours after online publication and is updated daily on week days.
Initial download of the metrics may take a while.