Open Access
Fig. 11
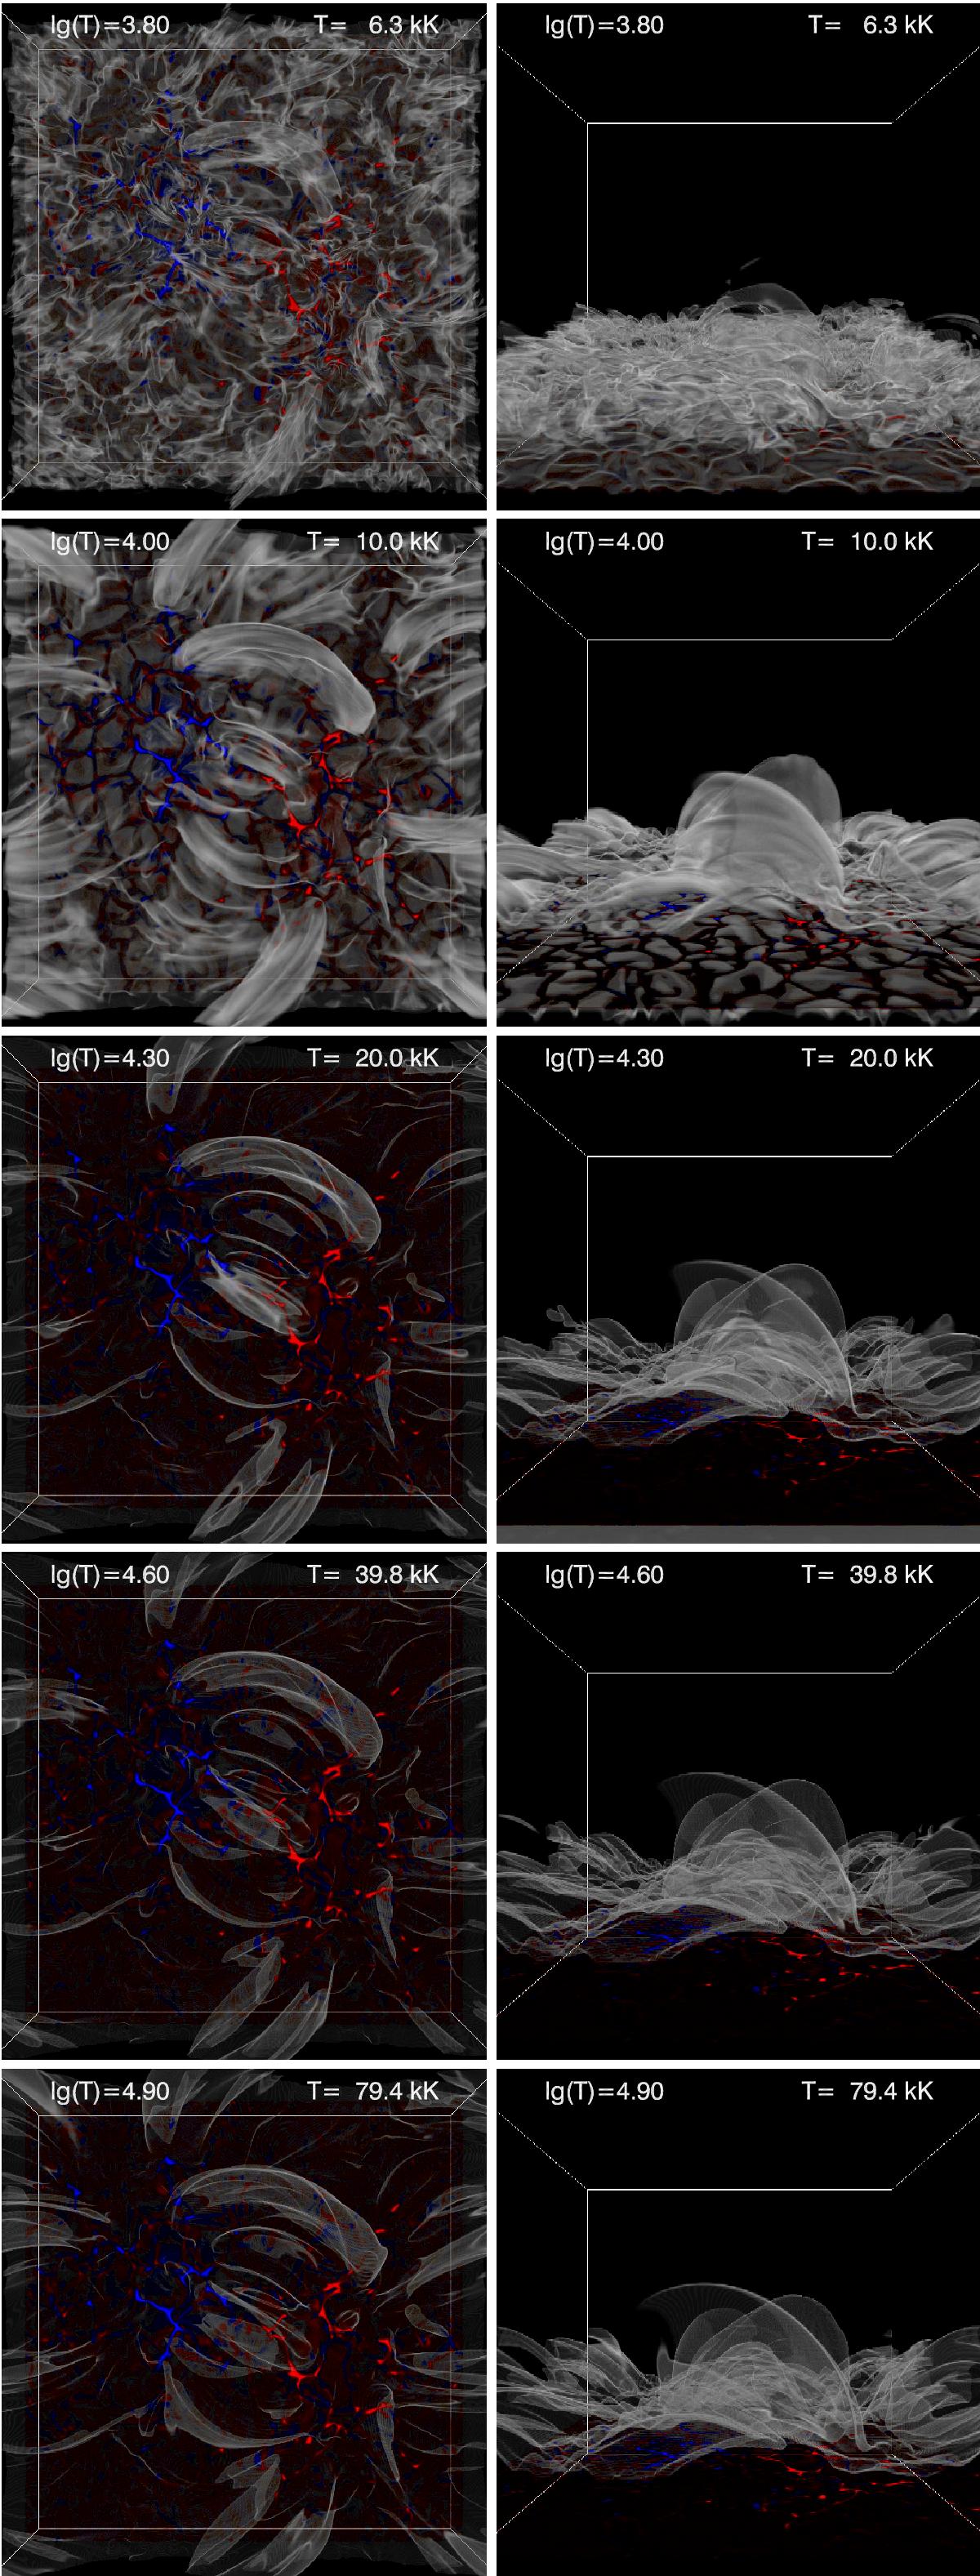
Volume rendering of the temperature distribution at t = 5440 s viewed from the top (left) and side (right). Bz at z = 0 with positive (red) and negative (blue) polarity. The Moiré patterns are artefacts of the volume visualisation.
Current usage metrics show cumulative count of Article Views (full-text article views including HTML views, PDF and ePub downloads, according to the available data) and Abstracts Views on Vision4Press platform.
Data correspond to usage on the plateform after 2015. The current usage metrics is available 48-96 hours after online publication and is updated daily on week days.
Initial download of the metrics may take a while.