Fig. 6
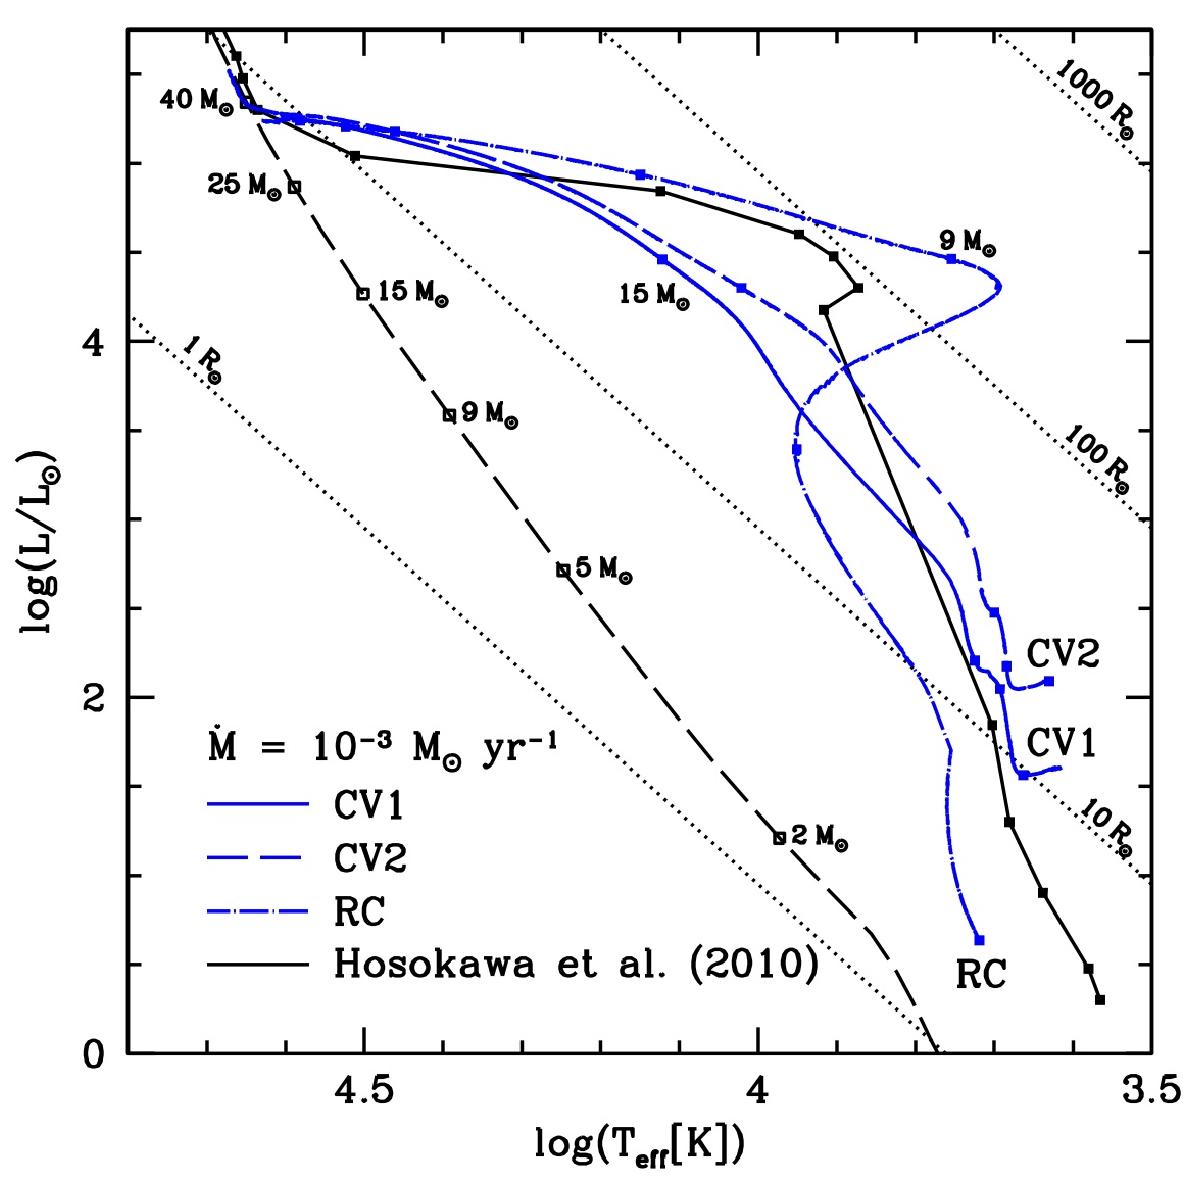
Evolutionary tracks of the models computed from the initial models CV1, CV2 and RC at Ṁ = 10-3M⊙ yr-1, using the new version of the code. For comparison, a series of points from the model MD3-D of Hosokawa et al. (2010) is indicated with connected black squares. The black dashed curve is the ZAMS of Ekström et al. (2012) with a few masses indicated, and the black dotted straight lines are iso-radius of 1, 10, 100 and 1000 R⊙. The blue squares along the tracks correspond to the same masses as those indicated along the ZAMS. (Notice that, on the vertical axis, L is the intrinsic stellar luminosity, without any contribution from the accretion luminosity.)
Current usage metrics show cumulative count of Article Views (full-text article views including HTML views, PDF and ePub downloads, according to the available data) and Abstracts Views on Vision4Press platform.
Data correspond to usage on the plateform after 2015. The current usage metrics is available 48-96 hours after online publication and is updated daily on week days.
Initial download of the metrics may take a while.