Fig. 2
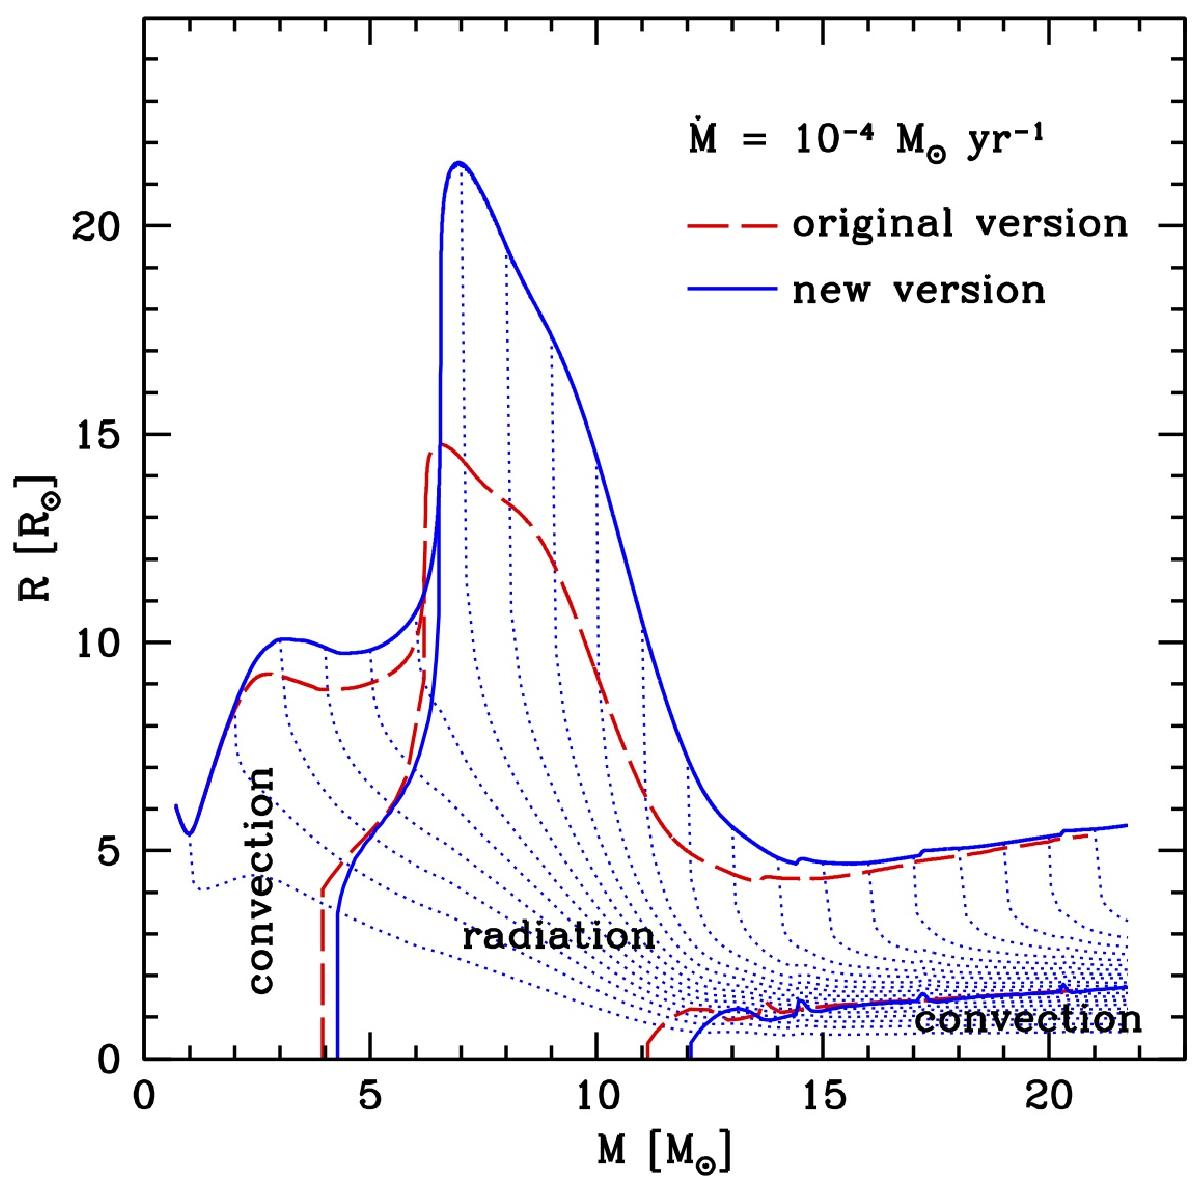
Evolution of the stellar radius and the internal structure for the same models as in Fig. 1. The horizontal axis corresponds to the stellar mass, which is a time coordinate in the case of accretion. In each case, the upper line indicates the stellar radius, the other continuous and long-dashed lines indicate the boundary between radiation and convection. The thin blue dotted lines are iso-mass of 1, 2, 3, ..., 21 M⊙ for the model computed with the new version of the code.
Current usage metrics show cumulative count of Article Views (full-text article views including HTML views, PDF and ePub downloads, according to the available data) and Abstracts Views on Vision4Press platform.
Data correspond to usage on the plateform after 2015. The current usage metrics is available 48-96 hours after online publication and is updated daily on week days.
Initial download of the metrics may take a while.