Fig. 11
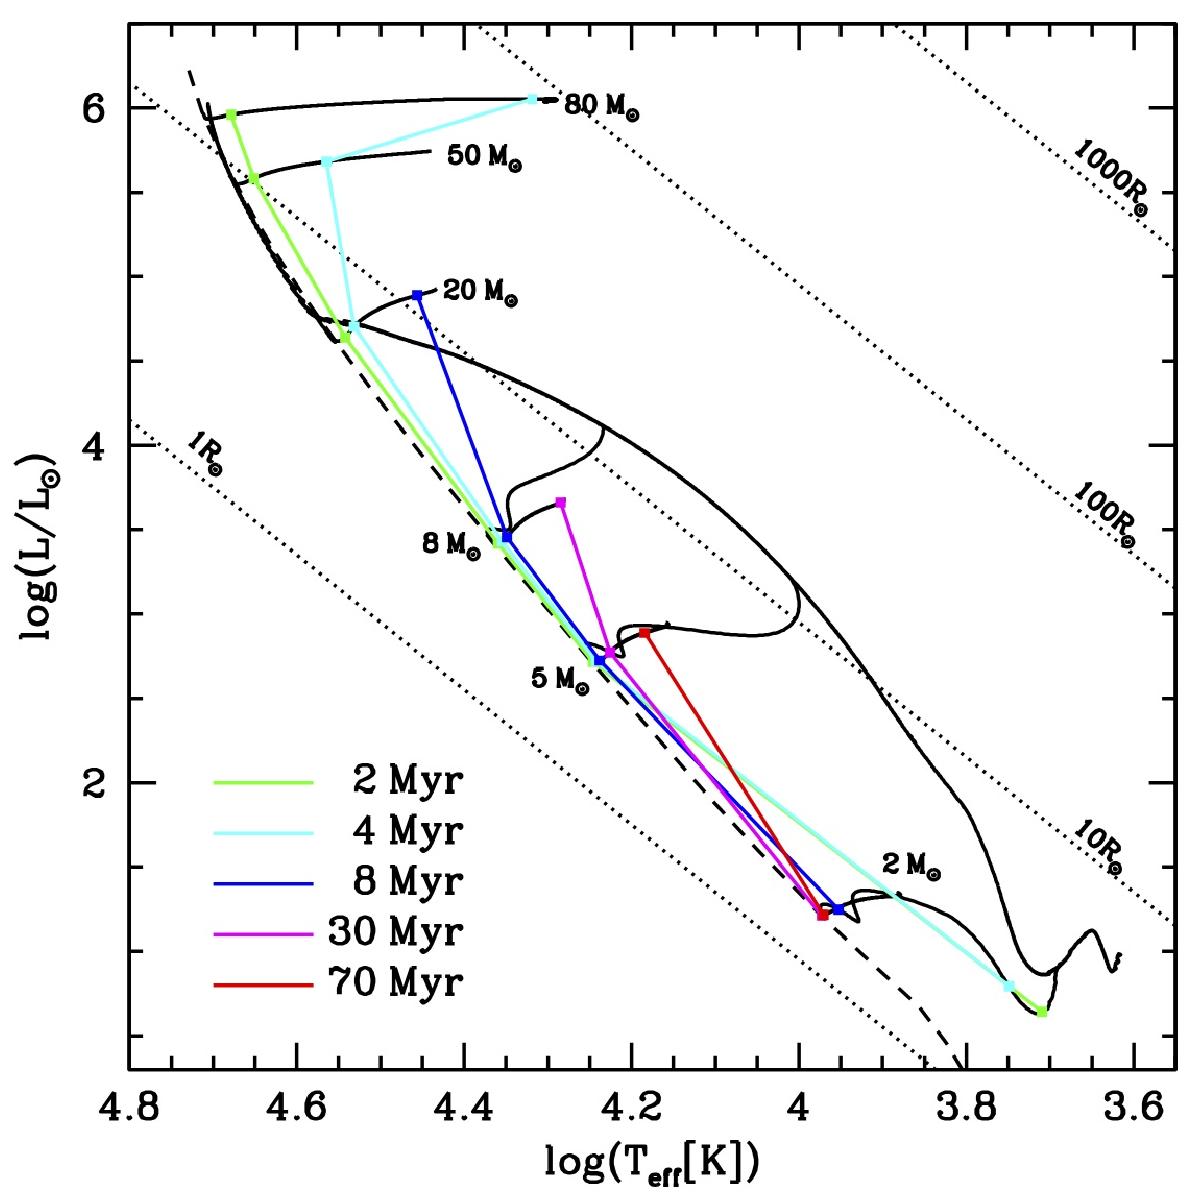
HR tracks of the birthline “new(1/11)” (Sect. 4.3), and the subsequent contractions and MS tracks for M = 2, 5, 8, 20, 50, and 80 M⊙ (solid black lines). Several isochrones are indicated with coloured solid lines. The iso-radius of 1, 10, 100, and 1000 R⊙ are indicated with black dotted lines and the ZAMS of Ekström et al. (2012) is shown with a black dashed line.
Current usage metrics show cumulative count of Article Views (full-text article views including HTML views, PDF and ePub downloads, according to the available data) and Abstracts Views on Vision4Press platform.
Data correspond to usage on the plateform after 2015. The current usage metrics is available 48-96 hours after online publication and is updated daily on week days.
Initial download of the metrics may take a while.