Fig. 10
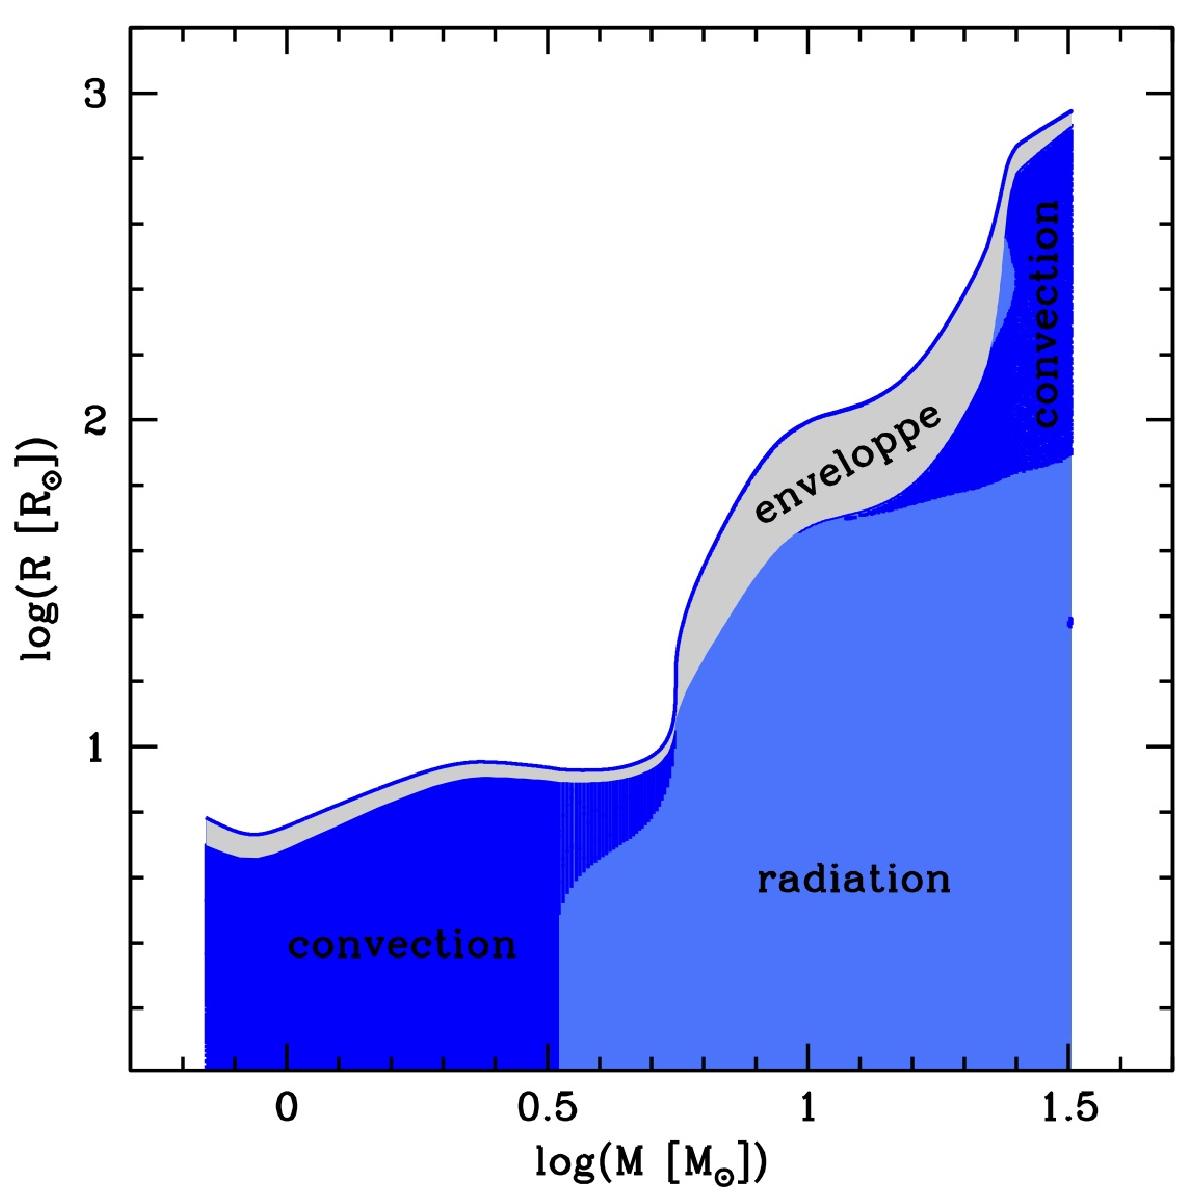
Evolution of the radius (upper blue curve) and the internal structure of the model “new (1/3)” of Fig. 7, i.e. of the model computed with the accretion rate of Eq. (19) with f = 1/3 using the new version of the code (Sect. 2), starting from the initial model given by Eq. (20). The dark blue areas are convective zones, the light blue areas are radiative regions, and the grey area is the envelope (see footnote 4).
Current usage metrics show cumulative count of Article Views (full-text article views including HTML views, PDF and ePub downloads, according to the available data) and Abstracts Views on Vision4Press platform.
Data correspond to usage on the plateform after 2015. The current usage metrics is available 48-96 hours after online publication and is updated daily on week days.
Initial download of the metrics may take a while.