Fig. 1
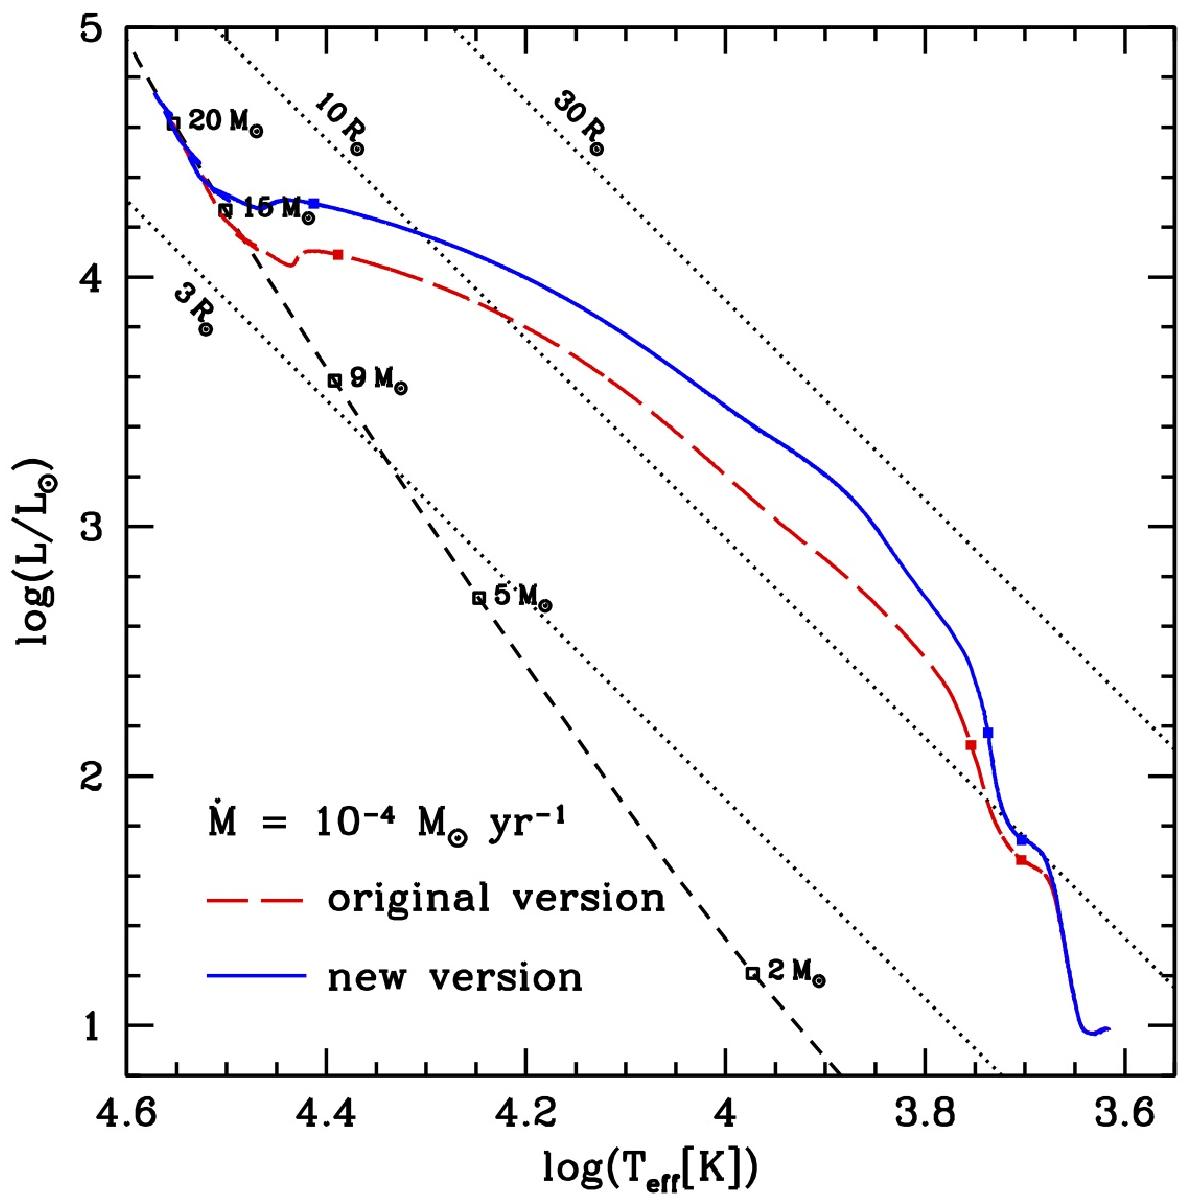
Evolutionary tracks of two models having the same initial conditions (Eq. (7)) accreting at the same rate (10-4M⊙ yr-1), but computed with the two different versions of the code. The black dotted straight lines are iso-radius for the indicated values of R, and the black short-dashed line is the ZAMS of Ekström et al. (2012) with a few masses indicated. From bottom to top, the filled squares on each track are the apparition of the radiative core, the end of the convective envelope, and the apparition of the convective core (see Fig. 2).
Current usage metrics show cumulative count of Article Views (full-text article views including HTML views, PDF and ePub downloads, according to the available data) and Abstracts Views on Vision4Press platform.
Data correspond to usage on the plateform after 2015. The current usage metrics is available 48-96 hours after online publication and is updated daily on week days.
Initial download of the metrics may take a while.