Fig. 4
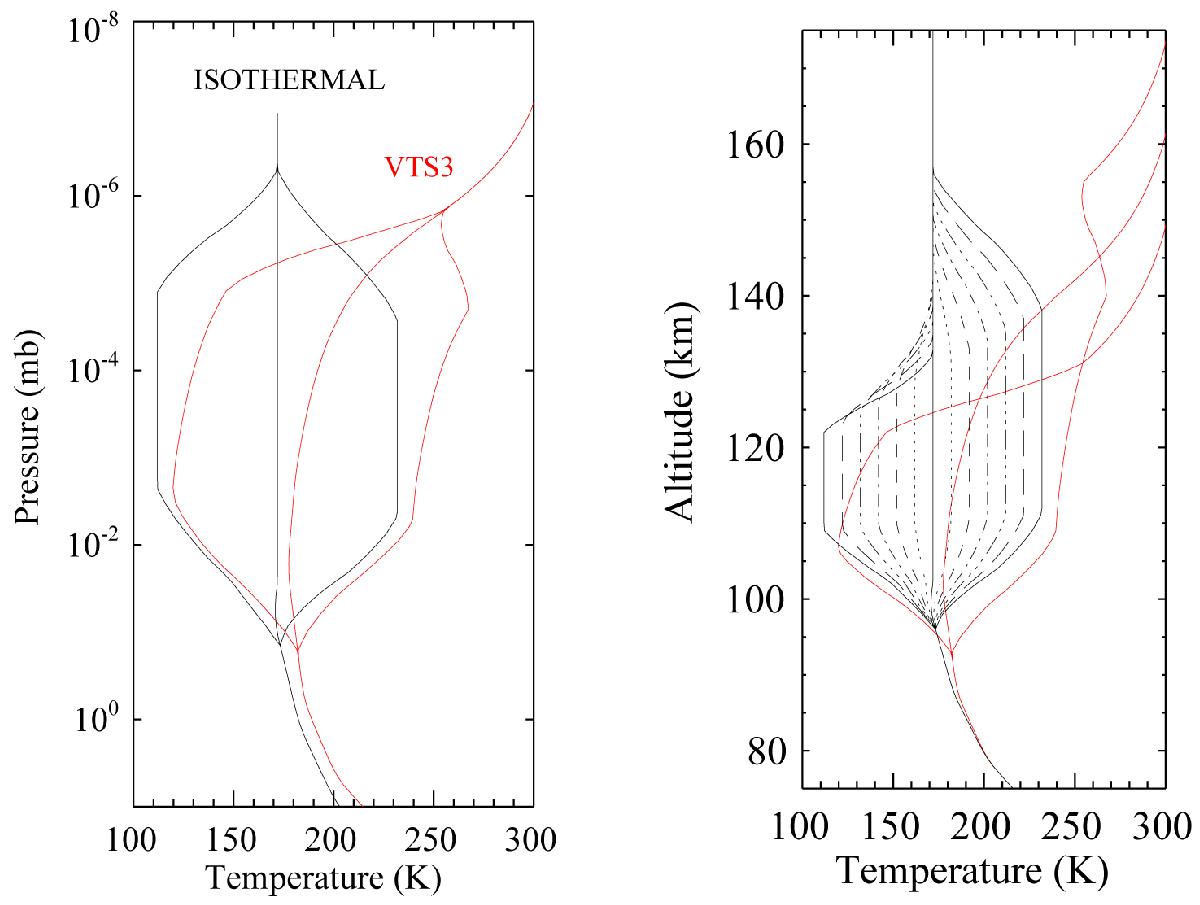
Thermal profiles used as reference for the set of temperature perturbations in vertical coordinates of pressure (A) and kilometers (B). The red curves corresponds to the thermal profiles from the reference atmosphere VTS3 (Hedin et al. 1983), while the black curve corresponds to an arbitrary isothermal profile. The sensed vertical region for temperature perturbations ranging from ±10 to ±60 K is labelled with different line styles.
Current usage metrics show cumulative count of Article Views (full-text article views including HTML views, PDF and ePub downloads, according to the available data) and Abstracts Views on Vision4Press platform.
Data correspond to usage on the plateform after 2015. The current usage metrics is available 48-96 hours after online publication and is updated daily on week days.
Initial download of the metrics may take a while.