Fig. 8
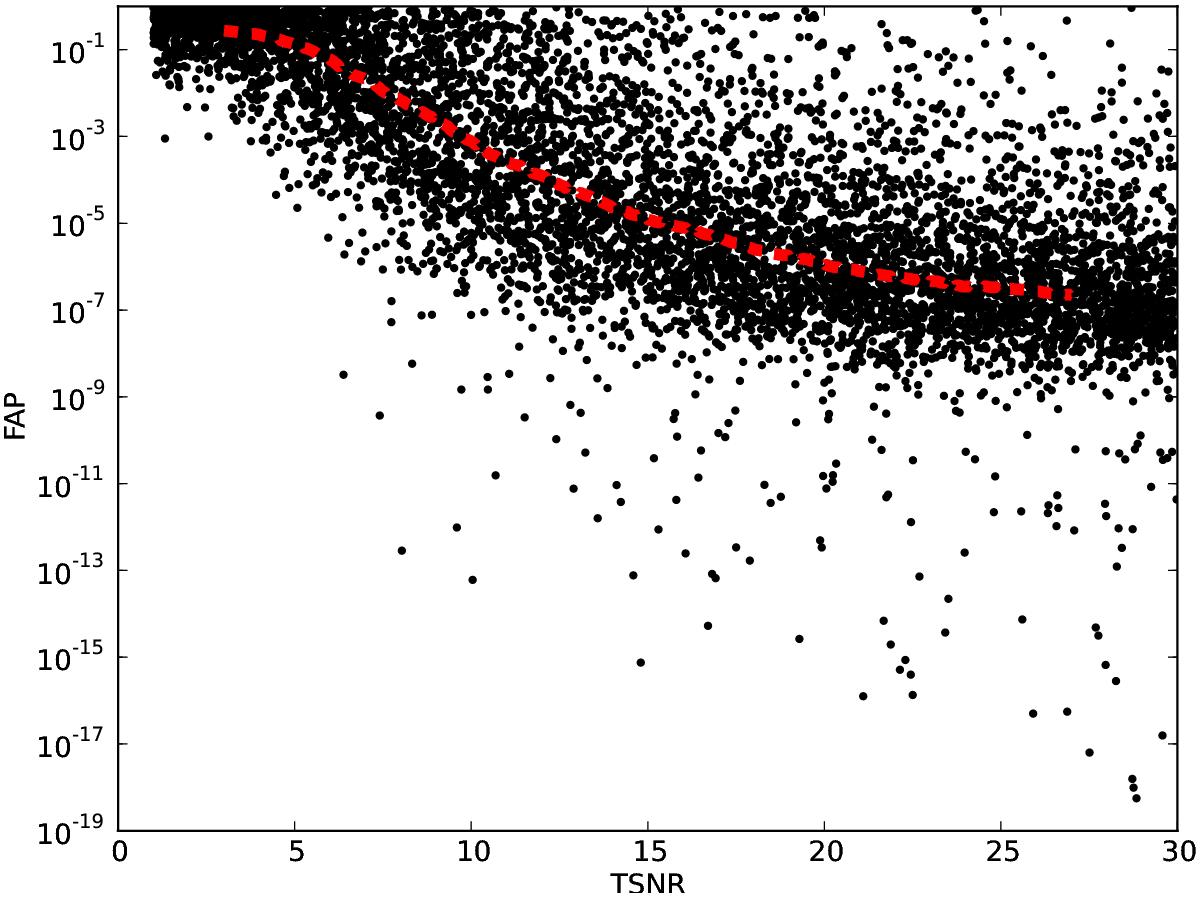
FAP of the highest peak in the Generalized Lomb-Scargle periodogram over the TSNR of the planetary transits for all 7500 simulation. On average, the strongest periods in the simulations become more significant for higher TSNRs. The red line demonstrates the running median of the FAP in TSNR bins of six. Most of the points larger than TSNR ≳ 15 have FAPs below 10-3.
Current usage metrics show cumulative count of Article Views (full-text article views including HTML views, PDF and ePub downloads, according to the available data) and Abstracts Views on Vision4Press platform.
Data correspond to usage on the plateform after 2015. The current usage metrics is available 48-96 hours after online publication and is updated daily on week days.
Initial download of the metrics may take a while.