Fig. 11
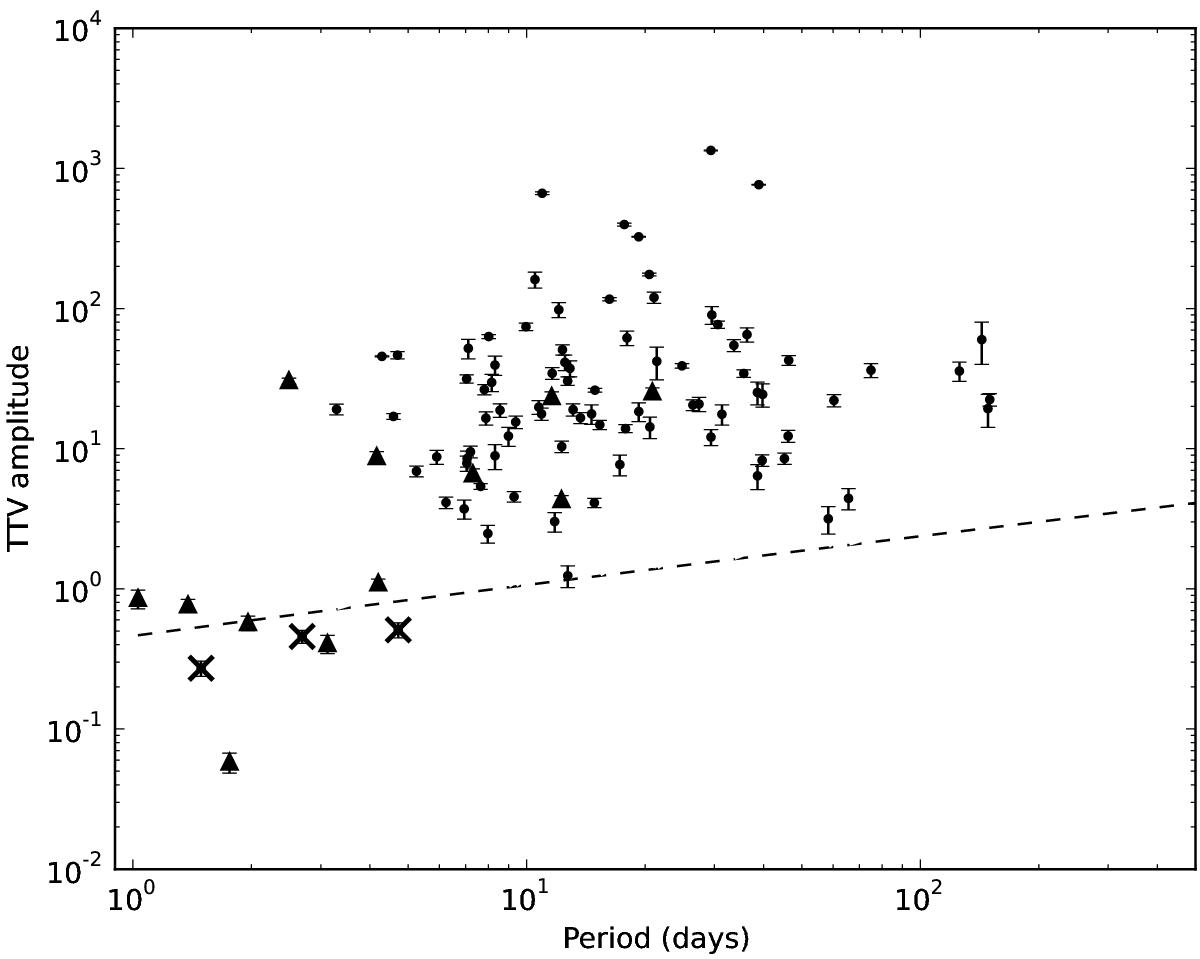
TTV amplitudes reported by Mazeh et al. (2013). The dashed line denotes a linear fit to the maximum amplitudes for TSNR = 30 (see Fig. 5). The points marked with X are found to have periods related to the stellar rotation; all of them lie well below our predicted amplitude maximum caused by spots. The points marked with triangles are taken as spurious which could have been caused by other sources capable of inducing TTVs (i.e., sampling or eclipsing binaries).
Current usage metrics show cumulative count of Article Views (full-text article views including HTML views, PDF and ePub downloads, according to the available data) and Abstracts Views on Vision4Press platform.
Data correspond to usage on the plateform after 2015. The current usage metrics is available 48-96 hours after online publication and is updated daily on week days.
Initial download of the metrics may take a while.