Fig. 9
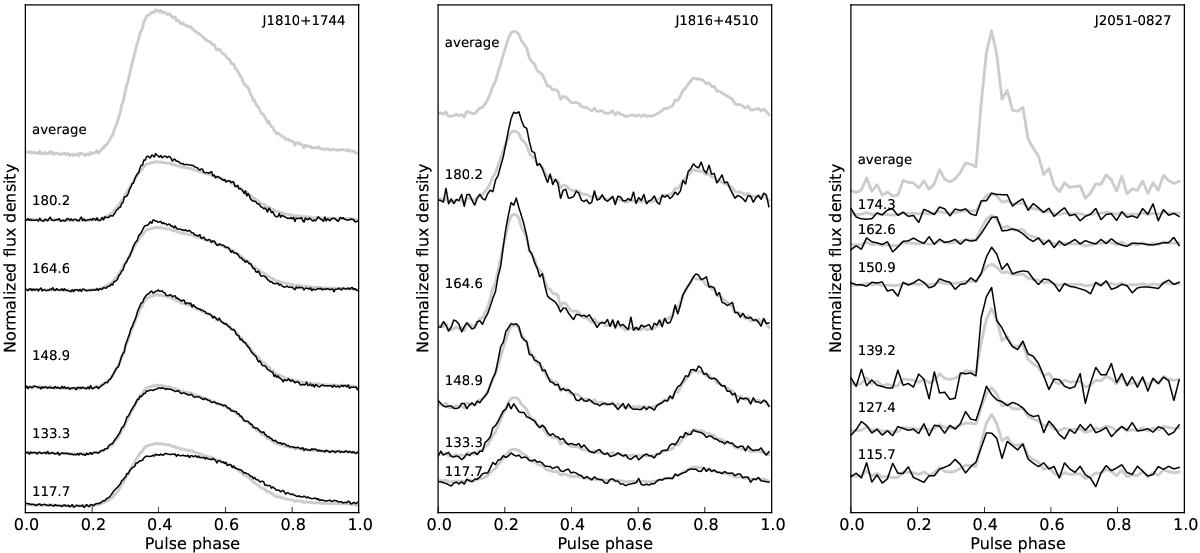
Profile evolution for three MSPs within the LOFAR HBA band. The number on the left in each panel gives the central frequency of the corresponding sub-band in MHz. The profile in grey on top of each panel is the average profile within the 78-MHz wide band. The profiles for each sub-band are normalised by its noise rms deviation. Each sub-band profile is overlaid with the average profile of the total band, in grey. To keep the integrated flux densities the same, the overlaid total-band average profile (in grey) is normalised by the ratio of areas under the total-band profile and the sub-band profile.
Current usage metrics show cumulative count of Article Views (full-text article views including HTML views, PDF and ePub downloads, according to the available data) and Abstracts Views on Vision4Press platform.
Data correspond to usage on the plateform after 2015. The current usage metrics is available 48-96 hours after online publication and is updated daily on week days.
Initial download of the metrics may take a while.