Fig. 7
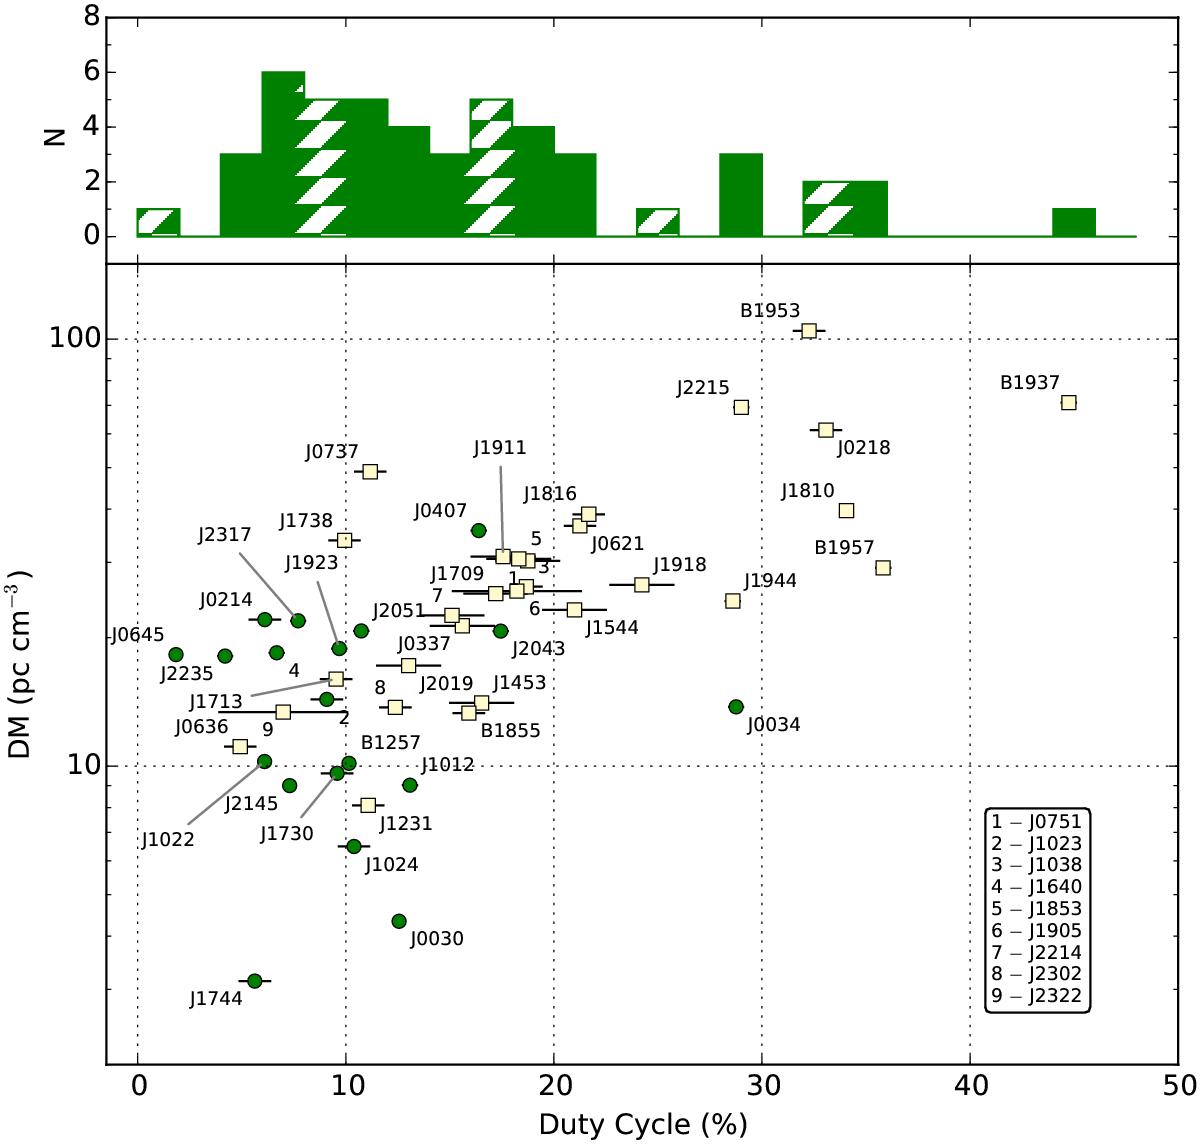
Dispersion measure versus the MSP duty cycle, δ. Green circles show MSPs with profiles which do not show an evident scattering tail – see δ values marked by an asterisk (⋆) in Table 4. Light yellow squares show all other MSPs. Errors in DMs including δDMorb (see Sect. 4.3) are smaller than the size of the marker for all MSPs. For MSPs without error bars, the uncertainty on δ is also less than the size of the marker. The top subplot shows the histogram of duty cycles for all detected MSPs.
Current usage metrics show cumulative count of Article Views (full-text article views including HTML views, PDF and ePub downloads, according to the available data) and Abstracts Views on Vision4Press platform.
Data correspond to usage on the plateform after 2015. The current usage metrics is available 48-96 hours after online publication and is updated daily on week days.
Initial download of the metrics may take a while.