Fig. 6
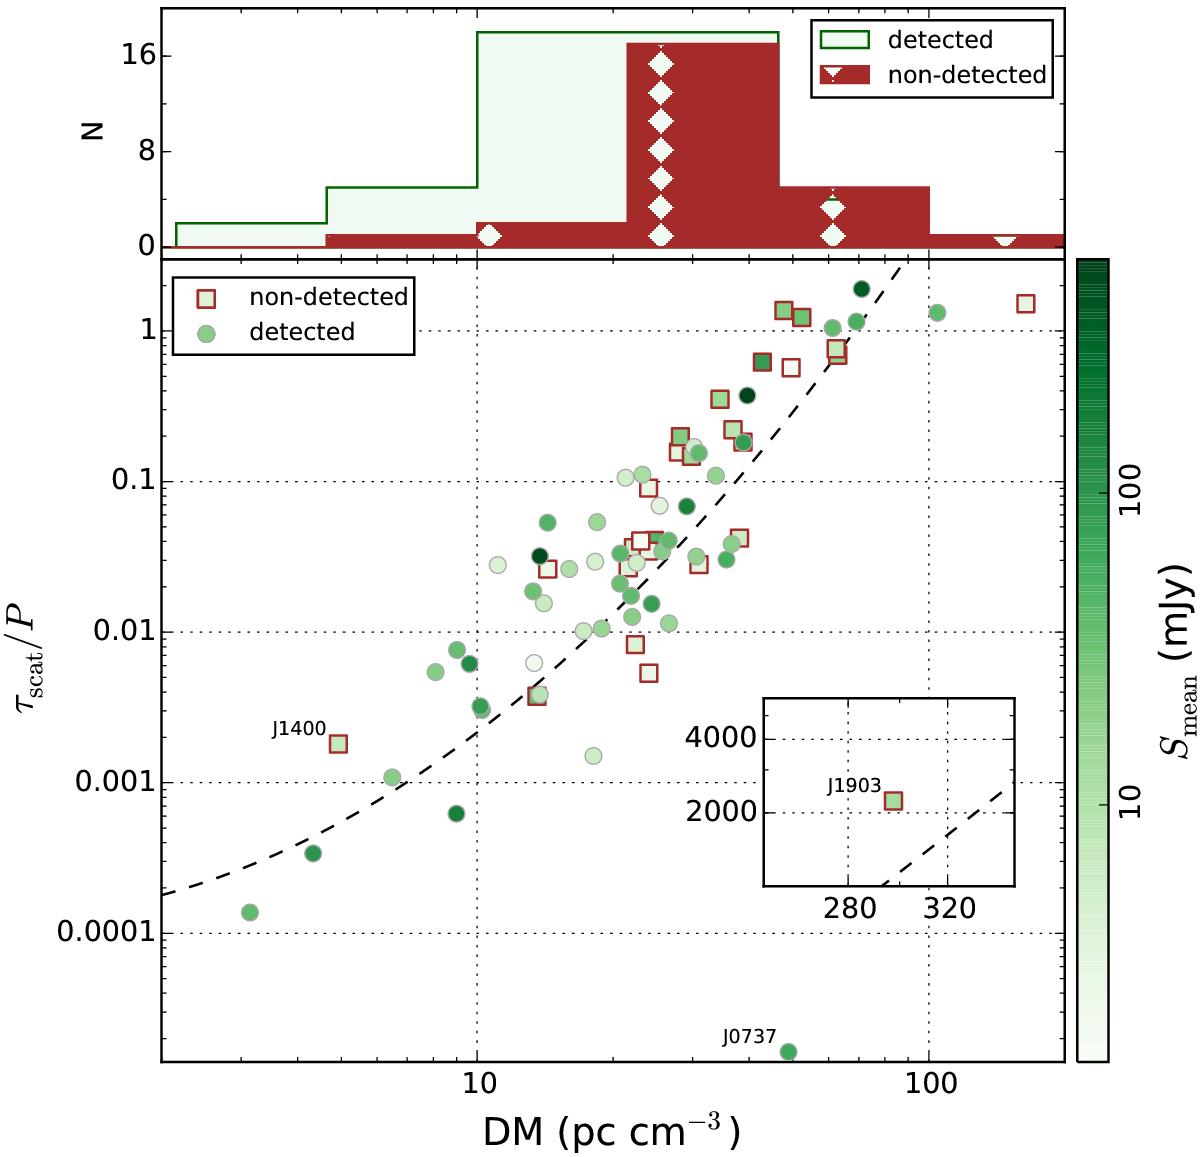
MSP detectability, or dependence of the ratio of predicted scattering time at 150 MHz over the pulsar period, τscat/P, on dispersion measure, DM. The green colour map corresponds to the measured mean flux density, Smean, at 110–188 MHz. Non-detected MSPs are shown with brown squares and their green intensity level corresponds to the measured upper limit of the mean flux density at 110–188 MHz. Scattering times at 150 MHz were calculated from the NE2001 Galactic free electron density model (Cordes & Lazio 2002) assuming a Kolmogorov spectrum of electron density inhomogeneities. The dashed line shows the empirical dependence between τscat and DM at 150 MHz from Bhat et al. (2004), where τscat is arbitrarily normalised by P = 4.075 ms, which is the median value of MSP periods in our sample of detected and non-detected MSPs. The top subplot shows the histograms of DMs for detected and non-detected MSPs. The inset plot is the same as the main plot but only for the non-detected PSR J1903+0327, which did not fit into the range of the main plot. PSR J1400−1438 was recently detected with LOFAR using the updated coordinates (J. Swiggum, priv. comm.) derived from over three years of timing with the GBT. The previously used catalogued position was off by about 6′, which is about two times larger than the full-width at half-maximum of LOFAR’s full-core tied-array beam at 150 MHz.
Current usage metrics show cumulative count of Article Views (full-text article views including HTML views, PDF and ePub downloads, according to the available data) and Abstracts Views on Vision4Press platform.
Data correspond to usage on the plateform after 2015. The current usage metrics is available 48-96 hours after online publication and is updated daily on week days.
Initial download of the metrics may take a while.