Fig. 3
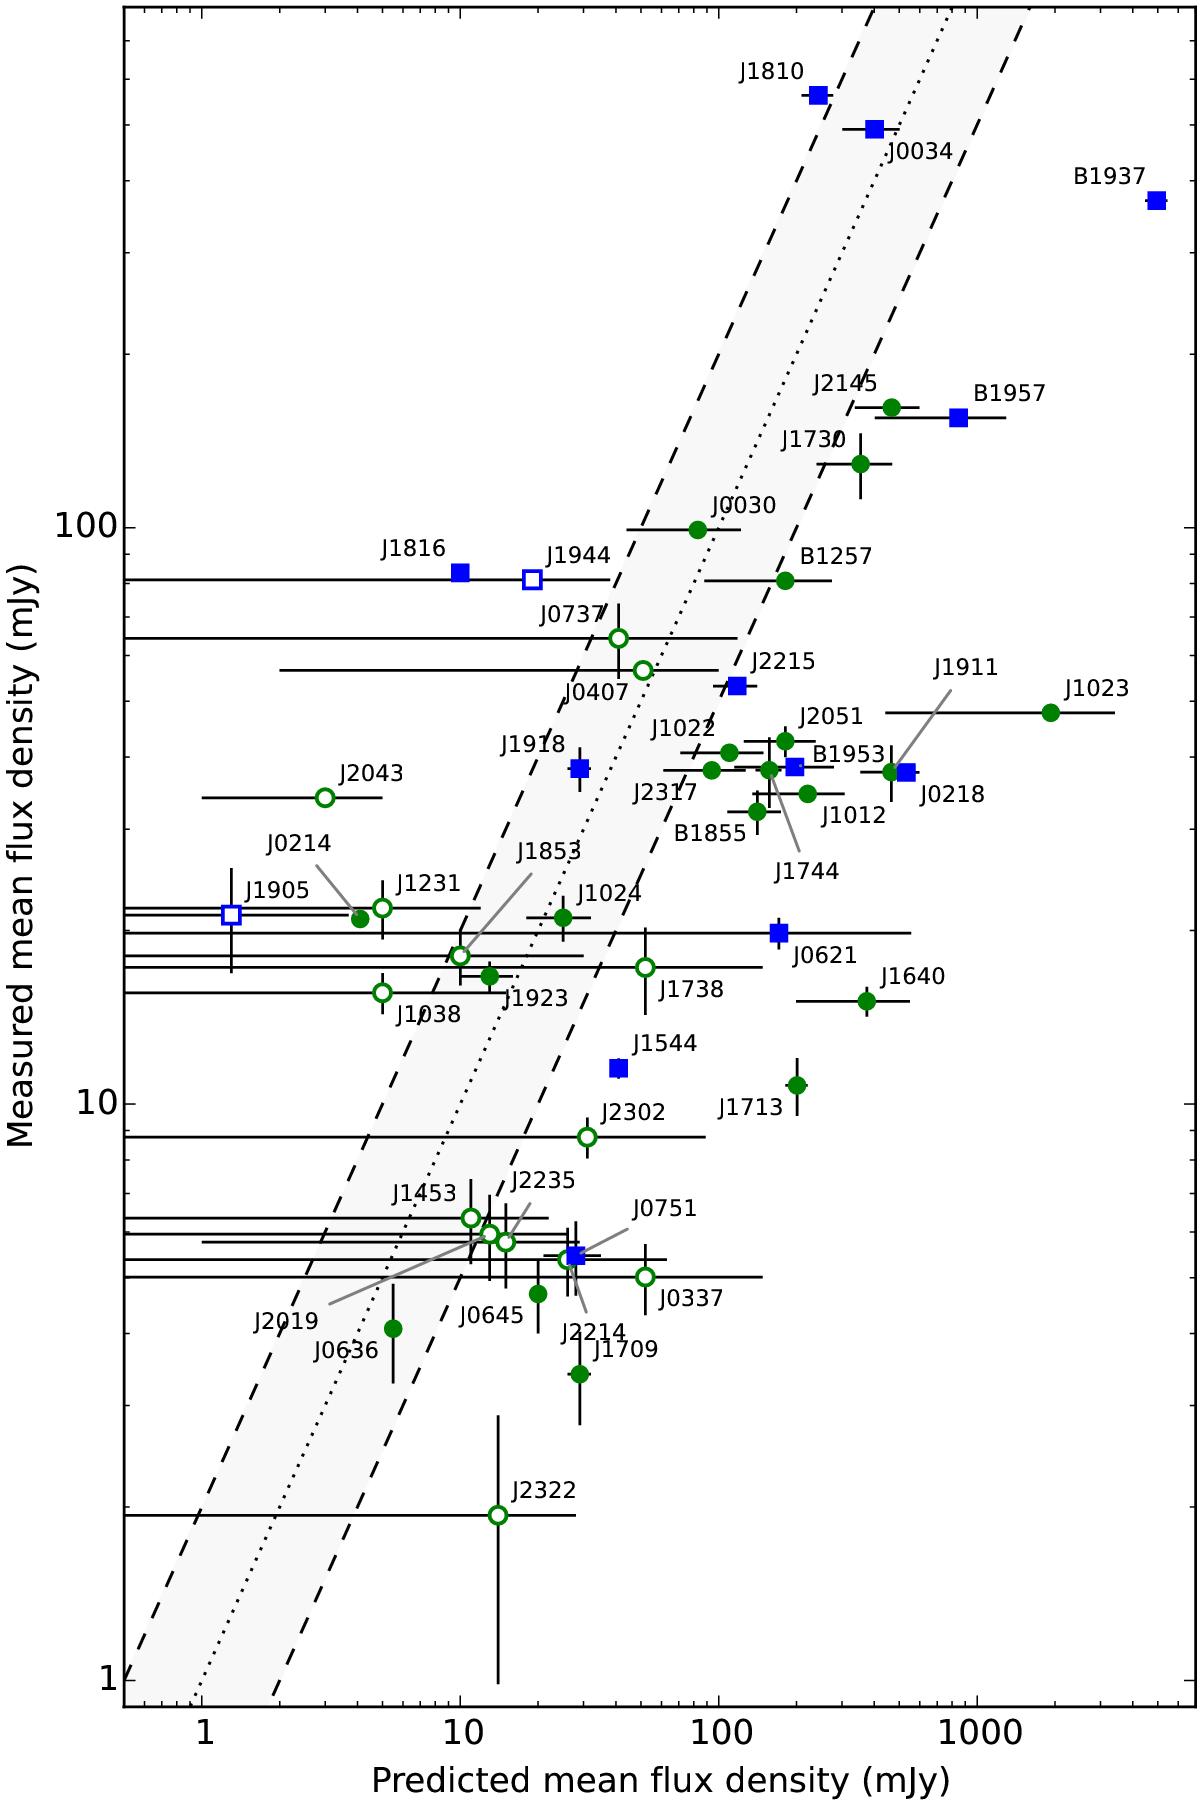
Measured mean flux densities at 110–188 MHz versus predicted flux densities using high-frequency data for 48 MSPs. The dotted line shows the loci of measured mean fluxes equal to predicted fluxes, and dashed lines mark the region where measured mean flux density deviates from predicted flux density by a factor of two. Open symbols show the MSPs for which spectral indices are not known, and the average index from Bates et al. (2013) was used, while solid symbols are for those with known spectral indices (see Table 4). Blue squares and green circles indicate MSPs with measured duty cycles >20% and <20%, respectively. Pulsars are labelled by their right ascension.
Current usage metrics show cumulative count of Article Views (full-text article views including HTML views, PDF and ePub downloads, according to the available data) and Abstracts Views on Vision4Press platform.
Data correspond to usage on the plateform after 2015. The current usage metrics is available 48-96 hours after online publication and is updated daily on week days.
Initial download of the metrics may take a while.