Fig. 8
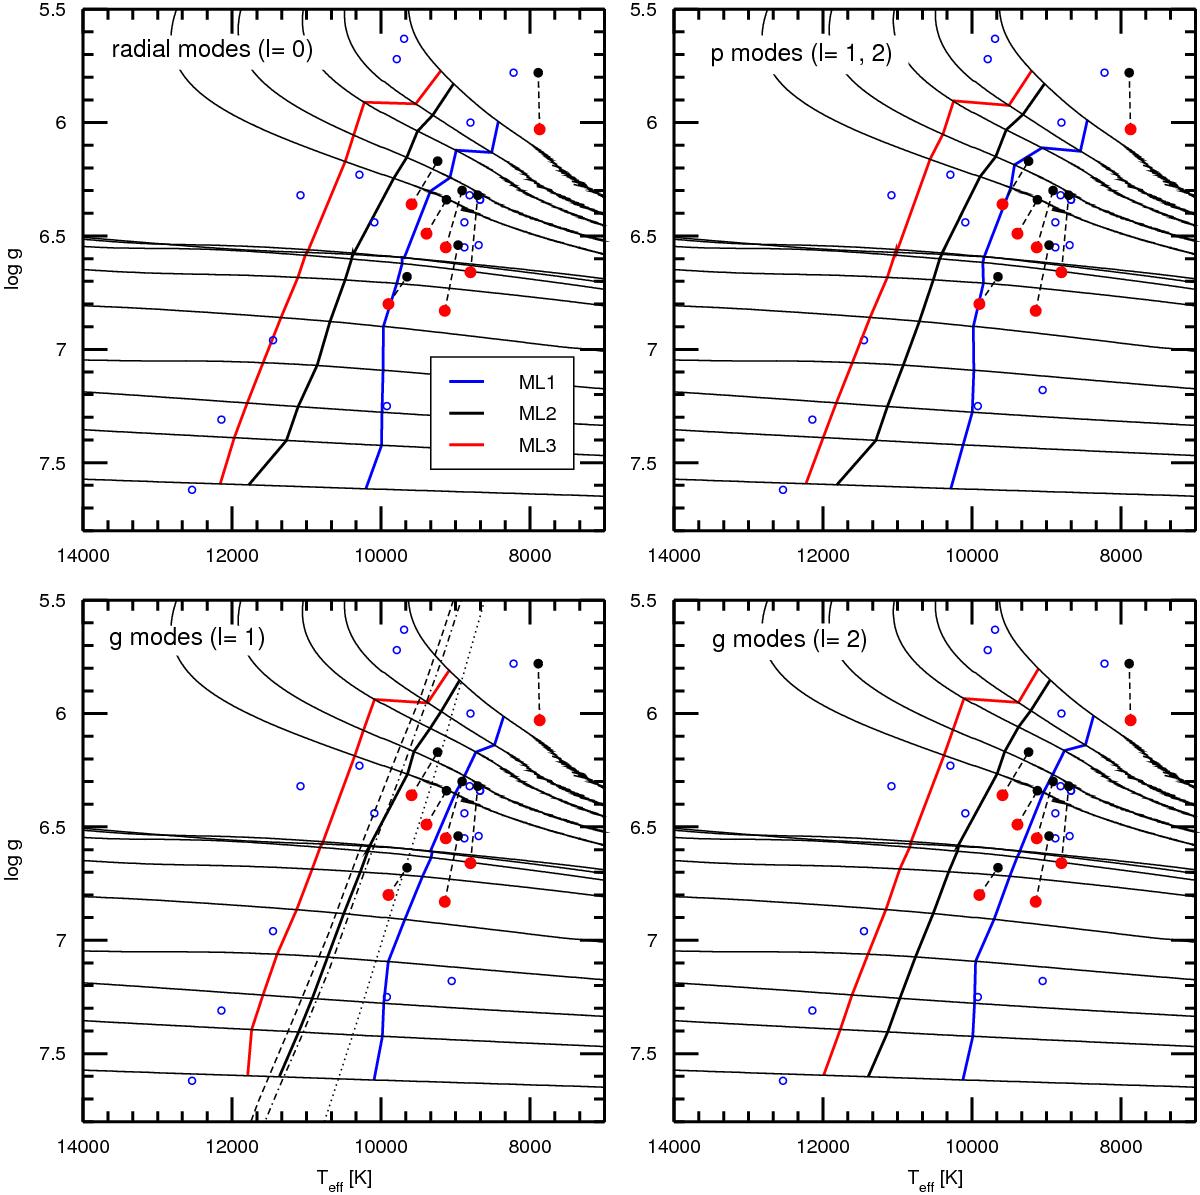
Teff−log g diagrams displaying our low-mass He-core WD evolutionary tracks along with the blue (hot) edge of the ELMV instability strip for radial (ℓ = 0) and nonradial (ℓ = 1,2) p and g modes, corresponding to different versions of the MLT theory of convection: ML1 (blue), ML2 (black), and ML3 (red). Again, the known ELMVs and the stars observed not to vary are also depicted. In the case of ℓ = 1g modes, we have included the blue edges computed with the TDC treatment (dashed black line) and the FC approximation (dot dashed black line), and also the red edge (dotted black line) of the instability strip from Van Grootel et al. (2013).
Current usage metrics show cumulative count of Article Views (full-text article views including HTML views, PDF and ePub downloads, according to the available data) and Abstracts Views on Vision4Press platform.
Data correspond to usage on the plateform after 2015. The current usage metrics is available 48-96 hours after online publication and is updated daily on week days.
Initial download of the metrics may take a while.