Fig. 7
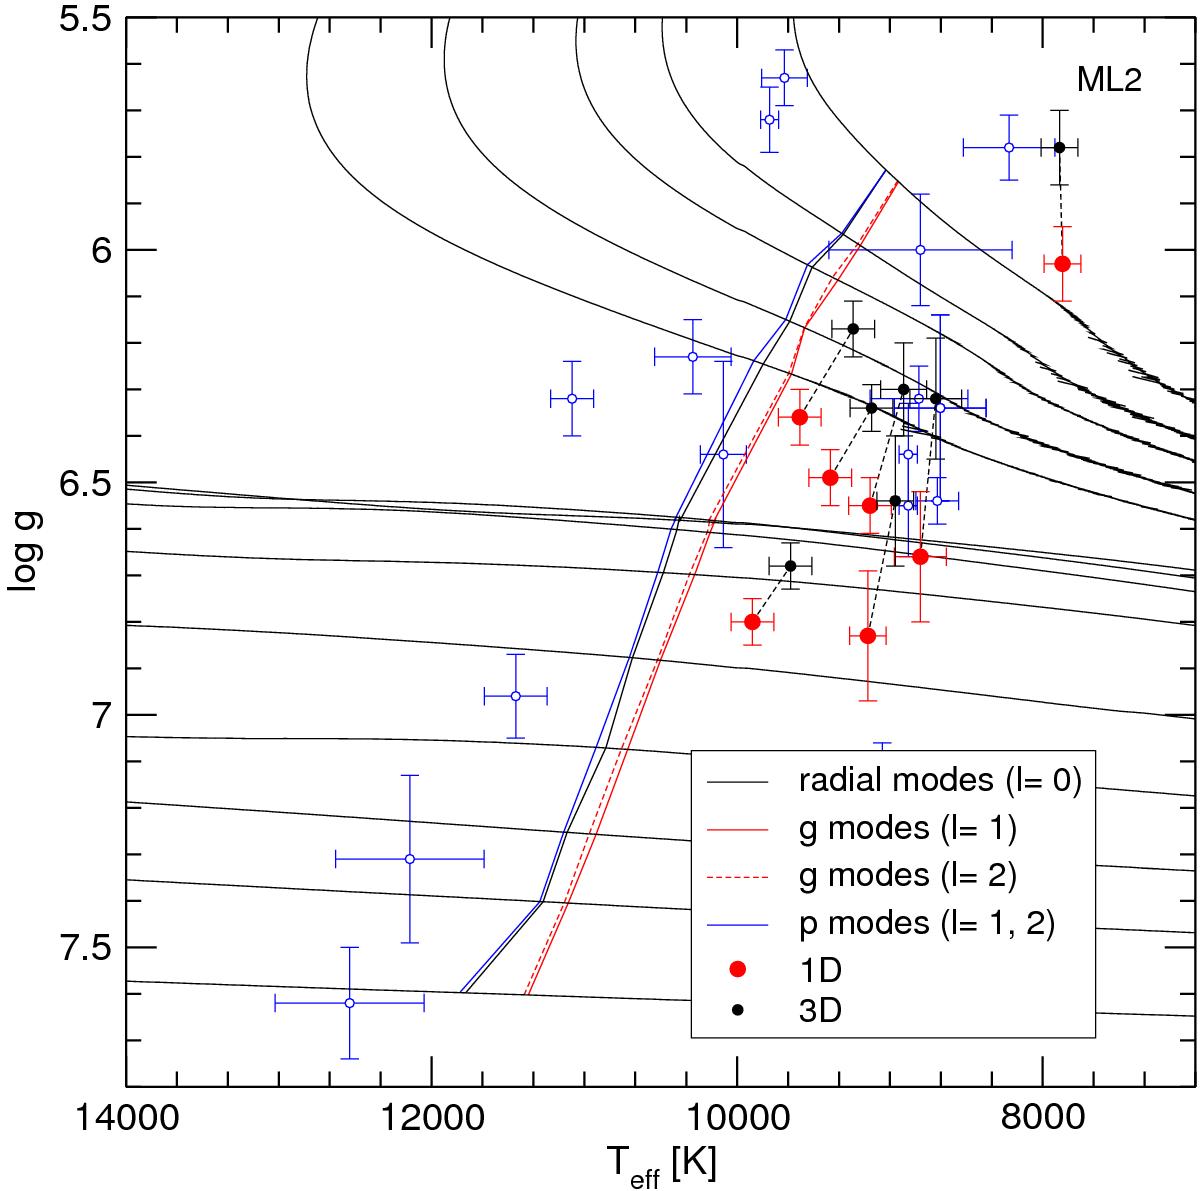
Teff−log g diagram showing the blue edge of the ELMV instability domain for the cases of radial modes (black solid line), nonradial dipole g modes (solid red line), nonradial quadrupole g modes (dashed red lines), and nonradial dipole and quadrupole p modes (blue solid line), for the case where stellar models are computed using the ML2 version of the MLT theory. The known ELMVs are also depicted. Filled red circles correspond to the location of the stars using 1D model atmospheres, filled black circles indicate their location according to 3D model atmospheres, and hollow blue circles are associated with low-mass WDs that are observed not to vary.
Current usage metrics show cumulative count of Article Views (full-text article views including HTML views, PDF and ePub downloads, according to the available data) and Abstracts Views on Vision4Press platform.
Data correspond to usage on the plateform after 2015. The current usage metrics is available 48-96 hours after online publication and is updated daily on week days.
Initial download of the metrics may take a while.