Fig. 6
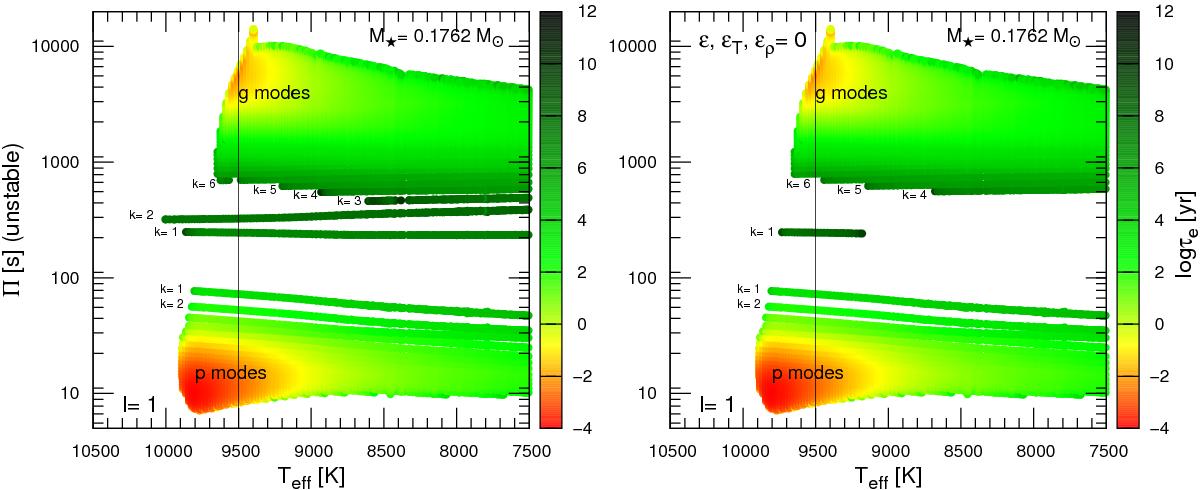
Left panel: unstable ℓ = 1 mode periods (Π) in terms of the effective temperature, corresponding to the ELM WD model sequence with M⋆ = 0.1762 M⊙. Color coding indicates the value of the logarithm of the e-folding time (τe) of each unstable mode (right scale). The vertical line indicates the effective temperature of the template model analyzed in Fig. 3. Right panel: same as left panel, but for the case in which the action of the ε mechanism is neglected in the stability computations.
Current usage metrics show cumulative count of Article Views (full-text article views including HTML views, PDF and ePub downloads, according to the available data) and Abstracts Views on Vision4Press platform.
Data correspond to usage on the plateform after 2015. The current usage metrics is available 48-96 hours after online publication and is updated daily on week days.
Initial download of the metrics may take a while.