Free Access
Fig. 12
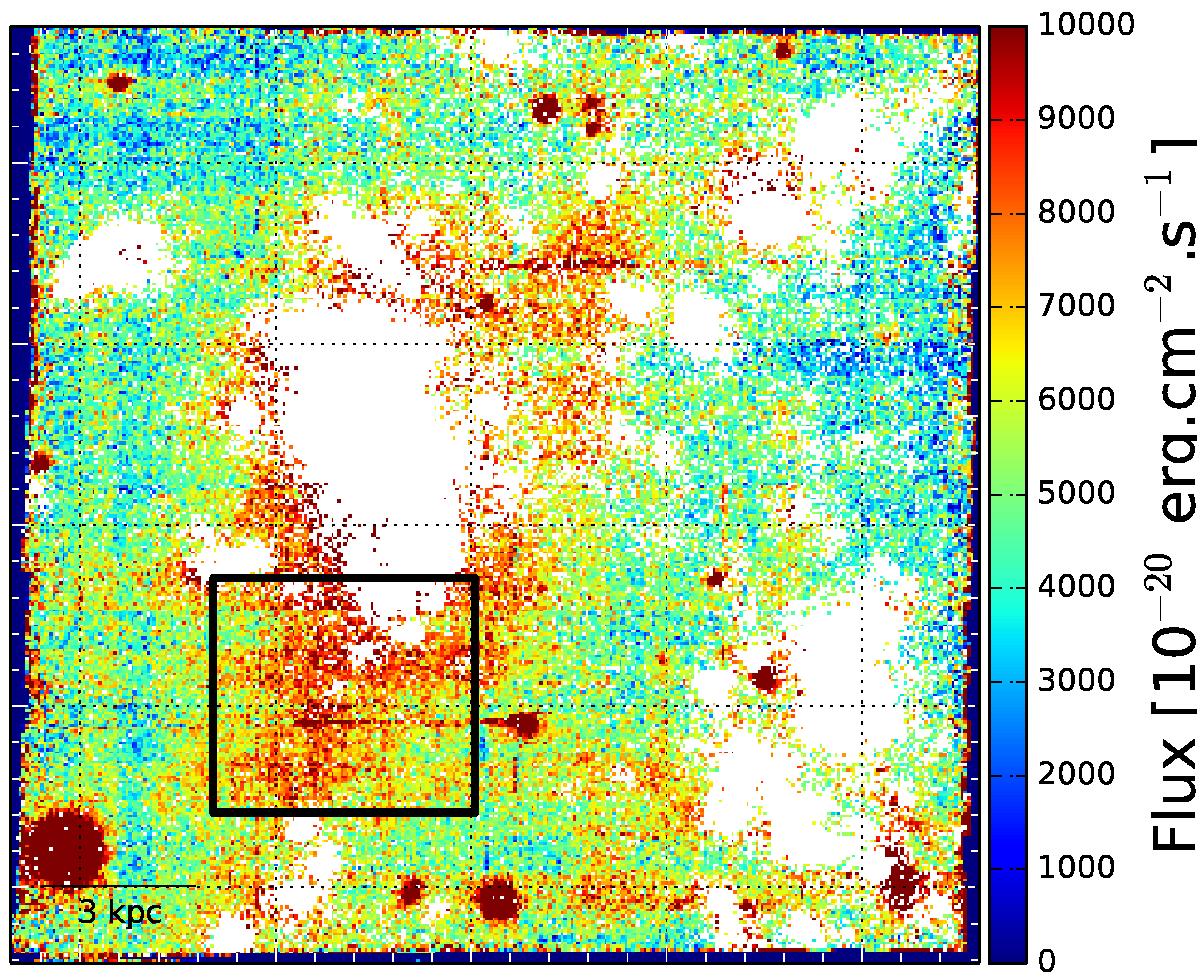
Integrated emission of the continuum in 10-20 erg s-1 cm2 between 4750 Å and 6000 Å. Spaxels for which a 3σ Hα emission was detected are shown in white. The black rectangle indicates the region whose spectra were combined to obtain the stacked spectra of Fig. 15. The field of view is the same as in Fig. 3.
Current usage metrics show cumulative count of Article Views (full-text article views including HTML views, PDF and ePub downloads, according to the available data) and Abstracts Views on Vision4Press platform.
Data correspond to usage on the plateform after 2015. The current usage metrics is available 48-96 hours after online publication and is updated daily on week days.
Initial download of the metrics may take a while.