Free Access
Fig. 7
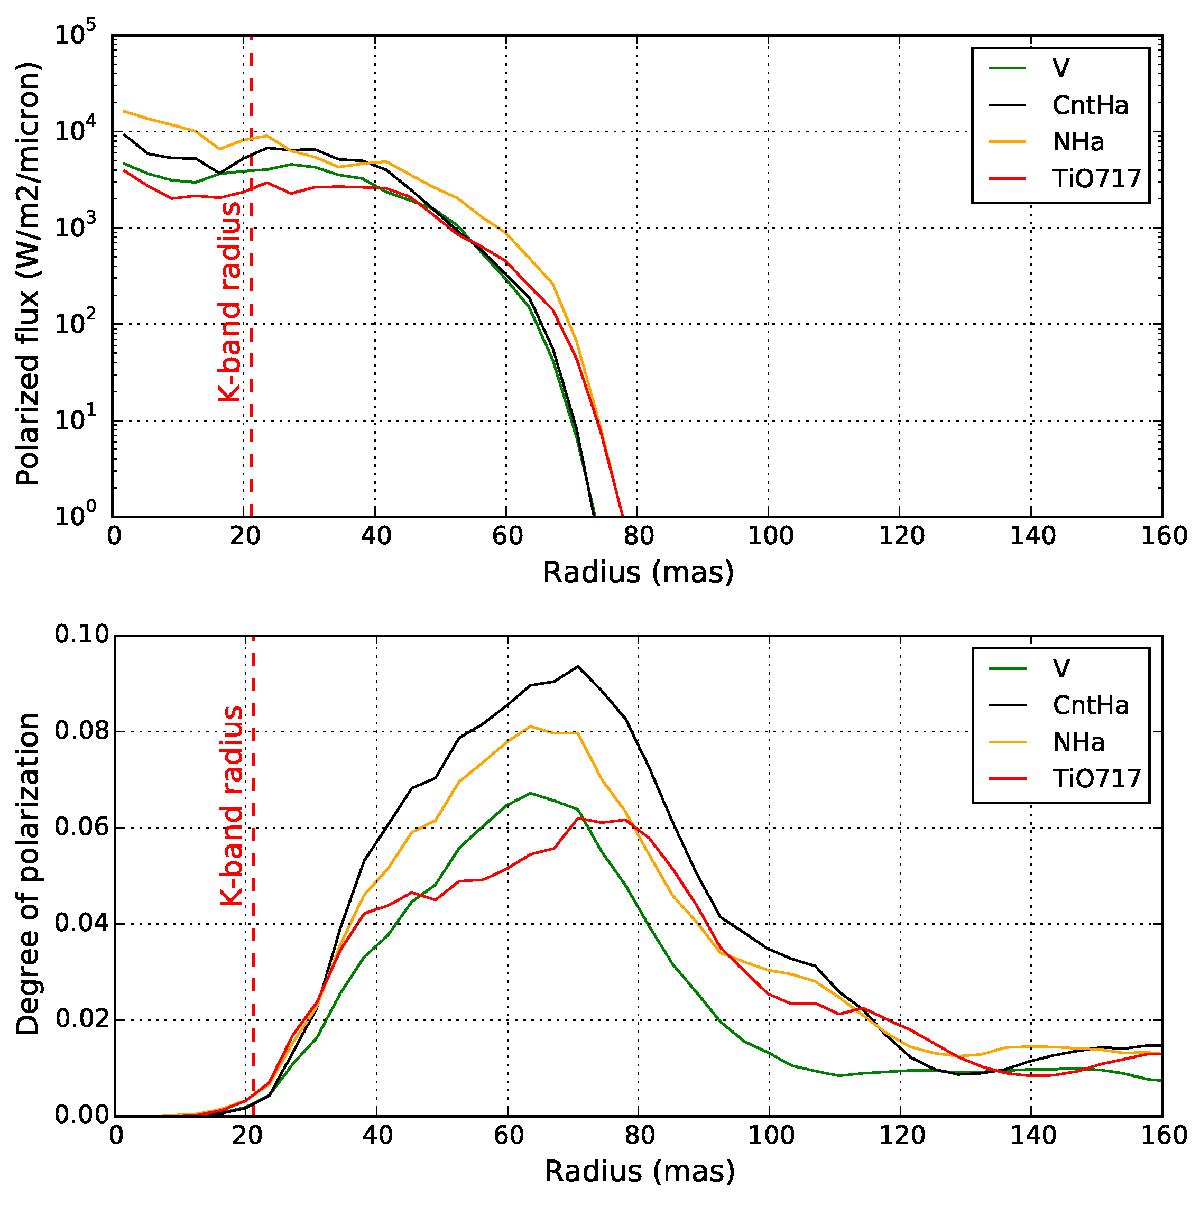
Top panel: radial median profile of the polarized flux P. Bottom panel: radial average profile of pL between azimuth 10° and 100°. Both plots are based on the lucy deconvolved maps (80 steps).
This figure is made of several images, please see below:
Current usage metrics show cumulative count of Article Views (full-text article views including HTML views, PDF and ePub downloads, according to the available data) and Abstracts Views on Vision4Press platform.
Data correspond to usage on the plateform after 2015. The current usage metrics is available 48-96 hours after online publication and is updated daily on week days.
Initial download of the metrics may take a while.