Fig. 2
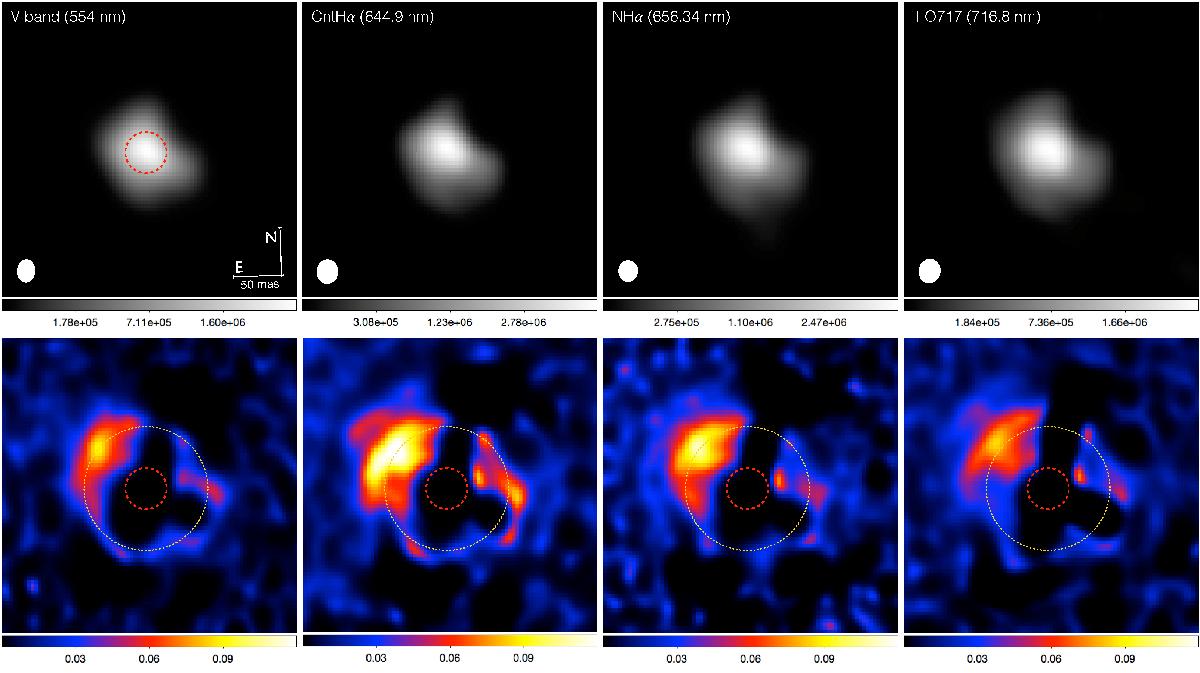
Top row: intensity images I, with a square root gray scale from minimum to maximum intensity (in W m-2 μm-1 sr-1). The dashed red circle represents the size of the photosphere in the near-infrared (R⋆). The beam size (FWHM of the PSF star images) is shown as a white ellipse in the lower left corner. Bottom row: maps of the degree of linear polarization pL, with a linear color scale from 0 to 12% (identical for all maps). The field of view is 302 × 302 mas, and all frames have been deconvolved using IRAF’s lucy algorithm (80 steps).
Current usage metrics show cumulative count of Article Views (full-text article views including HTML views, PDF and ePub downloads, according to the available data) and Abstracts Views on Vision4Press platform.
Data correspond to usage on the plateform after 2015. The current usage metrics is available 48-96 hours after online publication and is updated daily on week days.
Initial download of the metrics may take a while.