Fig. 6
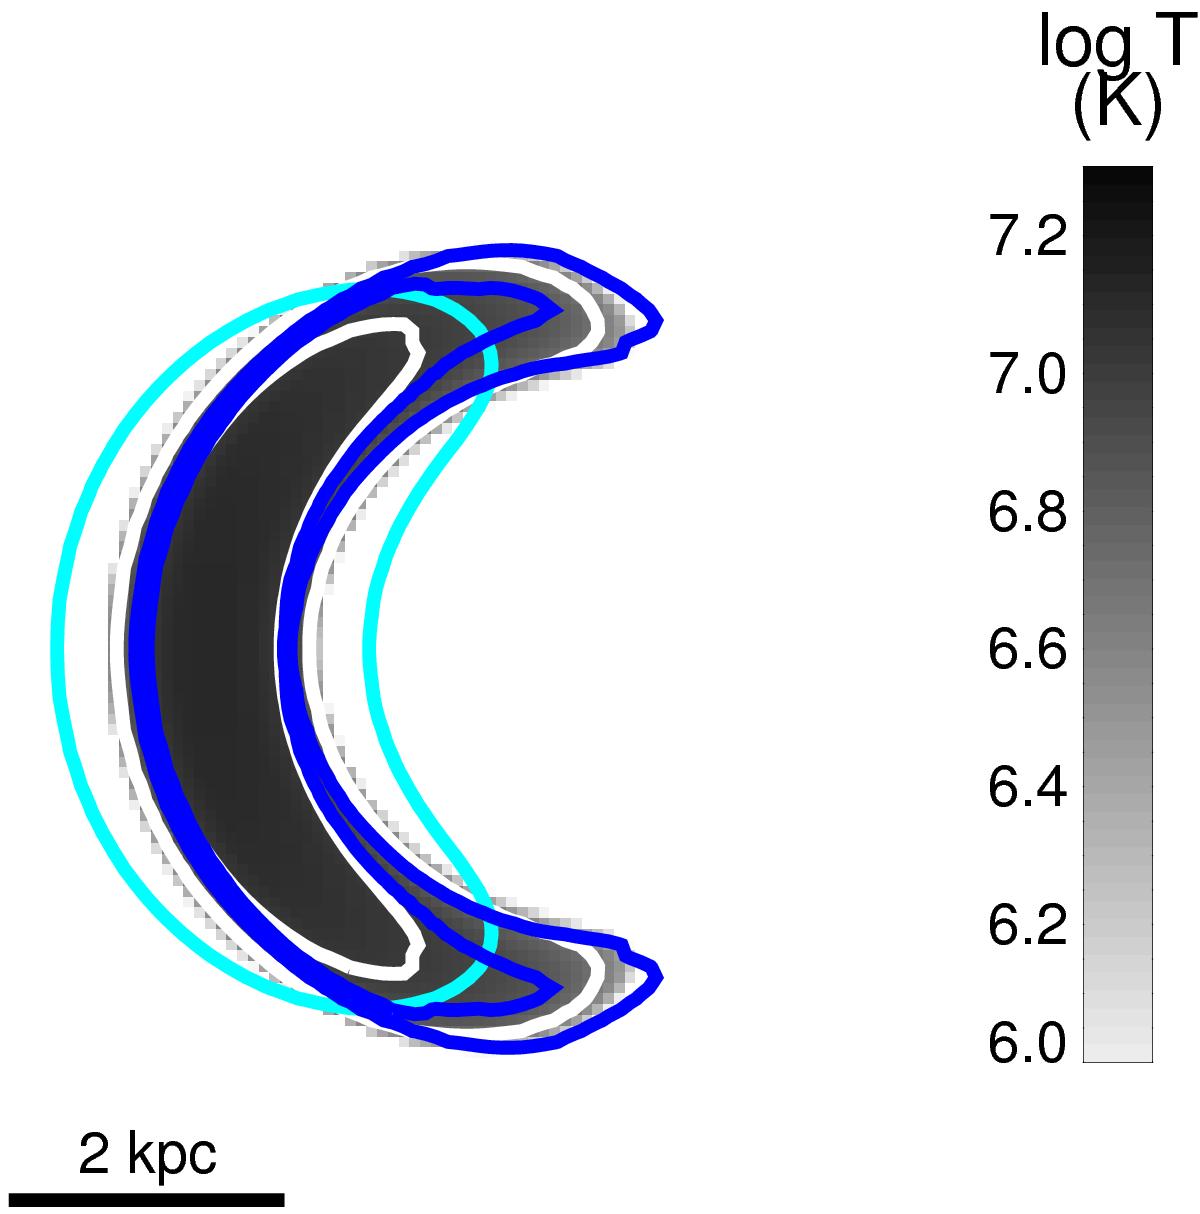
Temperature map at t = 2 Gyr for the heat conduction in a 2D magnetic loop with AMR and different fractions of perpendicular conductivity coefficients κiso = 0.1κSp (red contours), κiso = 0.01κSp (grey levels and white contours), and κiso = 0.001κSp (blue contours). Two contours are plotted for each simulation result corresponding to temperatures T = 5 × 10⁶ K and T = 107 K (except for κiso = 0.1κSp where only T = 5 × 10⁶ K is reached).
Current usage metrics show cumulative count of Article Views (full-text article views including HTML views, PDF and ePub downloads, according to the available data) and Abstracts Views on Vision4Press platform.
Data correspond to usage on the plateform after 2015. The current usage metrics is available 48-96 hours after online publication and is updated daily on week days.
Initial download of the metrics may take a while.