Fig. 3
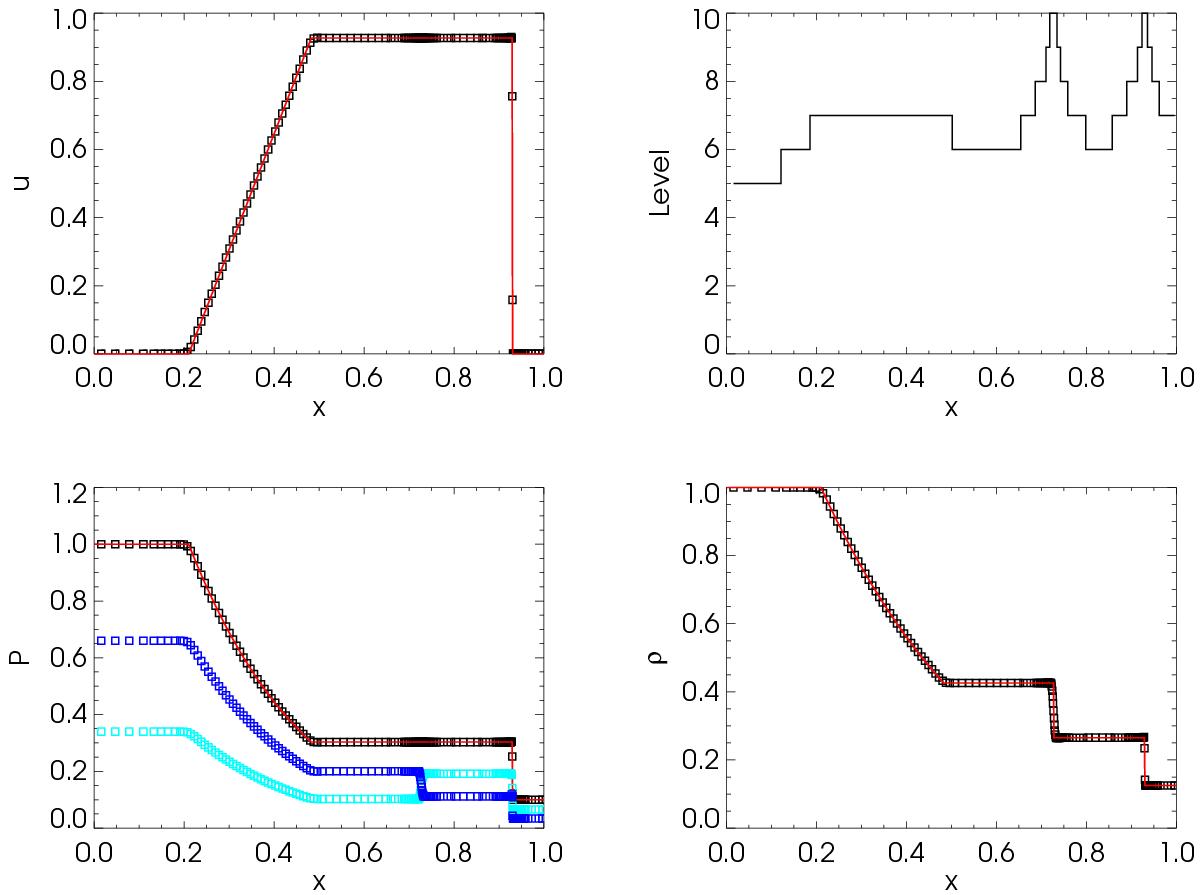
Solution of the Sod (1978) shock tube problem with two temperatures. There is no diffusion and coupling of the temperatures. We plot the velocity (top left), pressure (bottom left), and density (bottom right) at t = 0.245. The squares correspond to the result of the simulation and the red lines to the analytical solution. The light blue and dark blue squares in the pressure plot stand for the first and second species, respectively, while the black squares are for the total pressure. The level of refinement is plotted in the top right panel.
Current usage metrics show cumulative count of Article Views (full-text article views including HTML views, PDF and ePub downloads, according to the available data) and Abstracts Views on Vision4Press platform.
Data correspond to usage on the plateform after 2015. The current usage metrics is available 48-96 hours after online publication and is updated daily on week days.
Initial download of the metrics may take a while.