Fig. 1
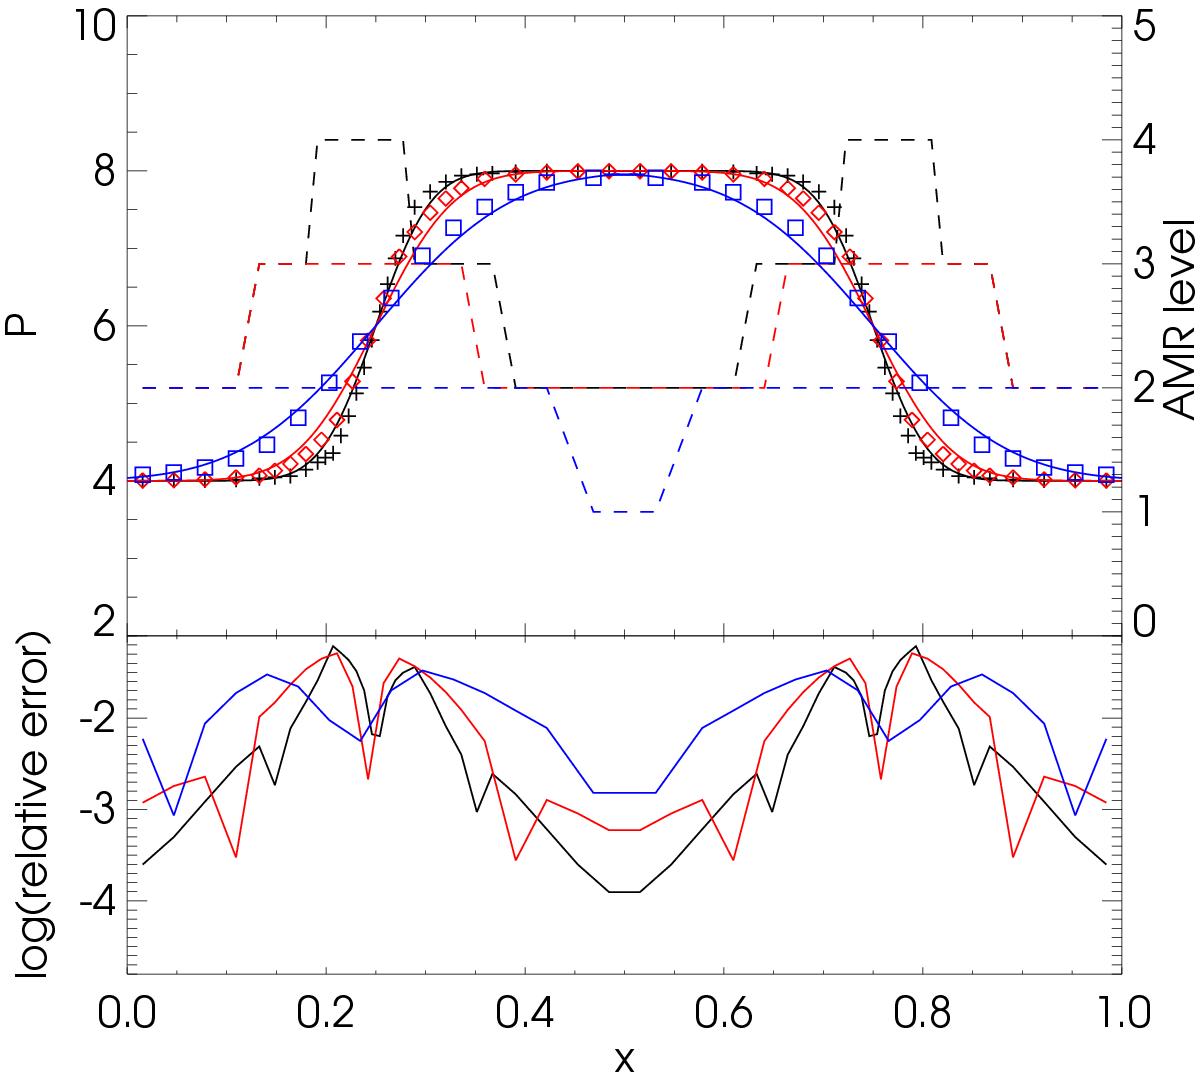
Top: diffusion of a pressure step function as a function of position at t = 9.3 × 10⁻⁴ (black), t = 1.9 × 10⁻³ (red), t = 5.6 × 10⁻³ (blue) for the simulation (symbols) and the analytic solution (solid lines). The extra levels of refinement are indicated as dashed lines. Bottom: relative errors of the simulation with respect to the analytic solution.
Current usage metrics show cumulative count of Article Views (full-text article views including HTML views, PDF and ePub downloads, according to the available data) and Abstracts Views on Vision4Press platform.
Data correspond to usage on the plateform after 2015. The current usage metrics is available 48-96 hours after online publication and is updated daily on week days.
Initial download of the metrics may take a while.