Fig. 7
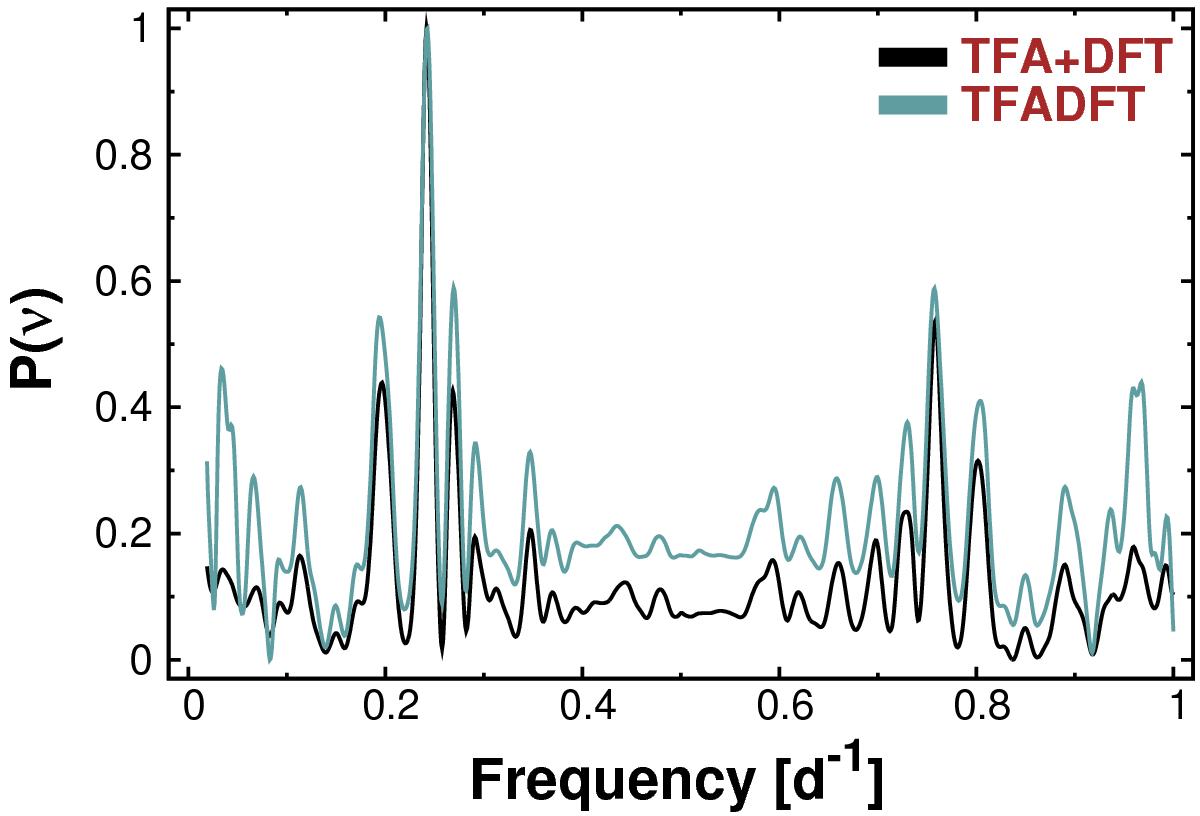
Example of the better performance of the partial time series model tfa+dft over the full model tfadft for the sine test signal (test signal #1 in Table 1). The spectra of one of the members of the 300 objects used in this section for testing the HATNet database are shown. The number of TFA templates is equal to 400. Both spectra are normalized to 1 at the highest peak.
Current usage metrics show cumulative count of Article Views (full-text article views including HTML views, PDF and ePub downloads, according to the available data) and Abstracts Views on Vision4Press platform.
Data correspond to usage on the plateform after 2015. The current usage metrics is available 48-96 hours after online publication and is updated daily on week days.
Initial download of the metrics may take a while.