Fig. 6
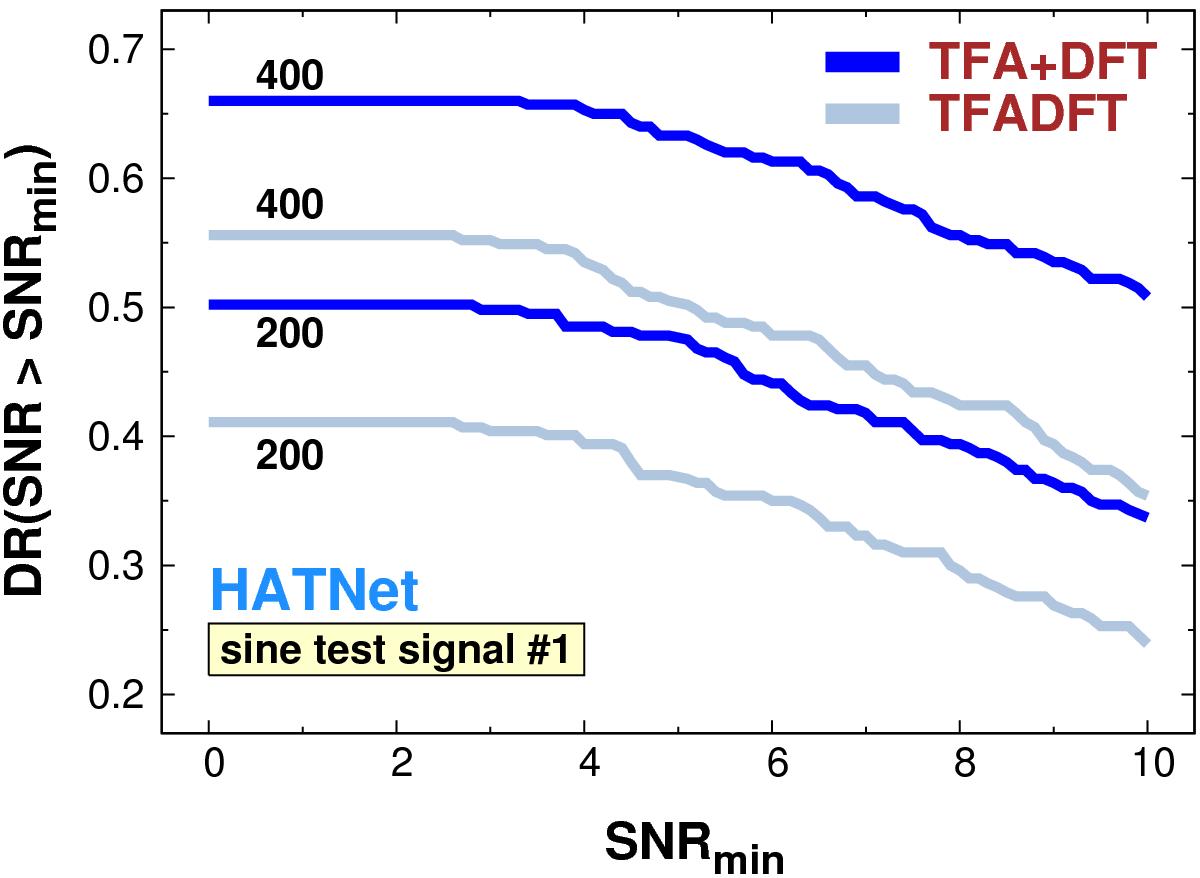
Detection ratio as a function of S/N for the sine test signal #1 of Table 1 on the HATNet sub-dataset. DR denotes the relative number of detections with SNR>SNRmin. The curves are labelled by the TFA template numbers. The partial time series models (blue lines with label tfa+dft) yield significantly higher detection rates than the full models (fainter lines with label tfadft).
Current usage metrics show cumulative count of Article Views (full-text article views including HTML views, PDF and ePub downloads, according to the available data) and Abstracts Views on Vision4Press platform.
Data correspond to usage on the plateform after 2015. The current usage metrics is available 48-96 hours after online publication and is updated daily on week days.
Initial download of the metrics may take a while.