Fig. 2
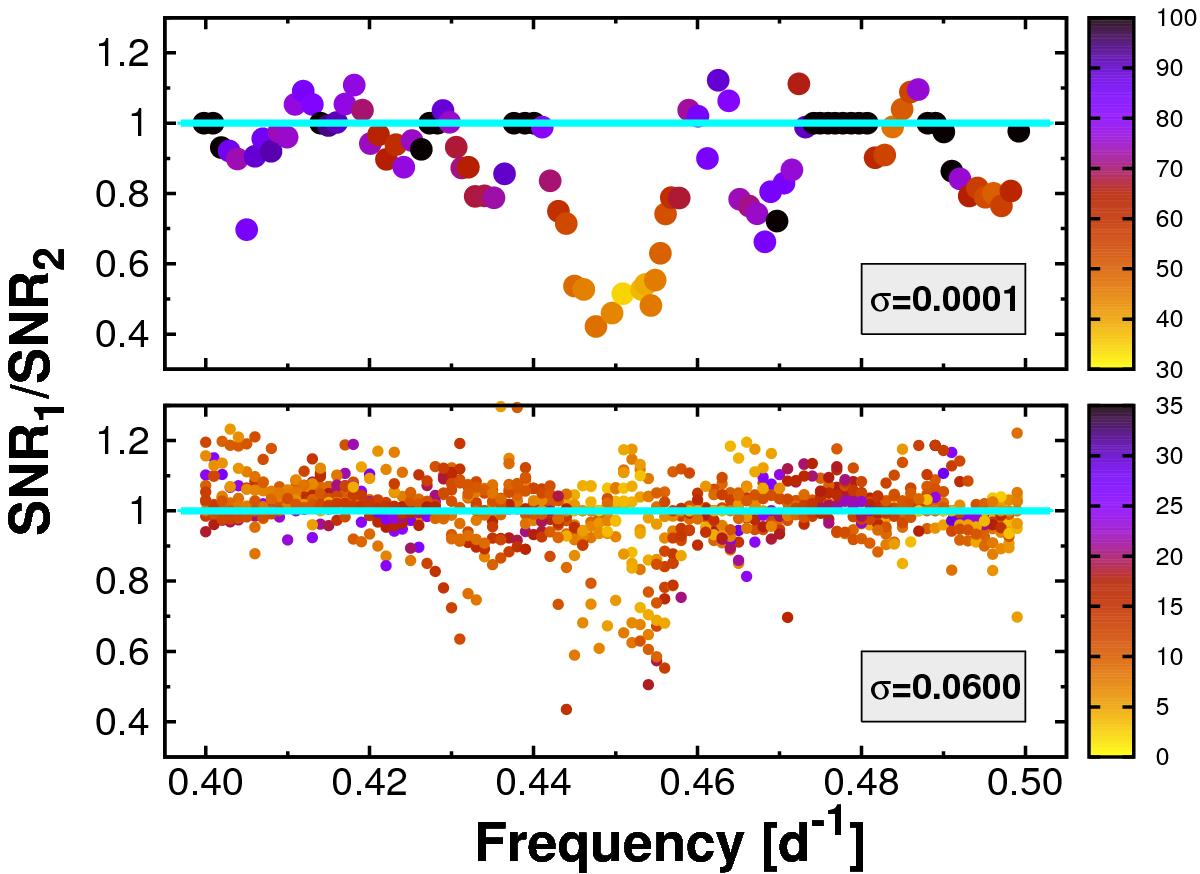
Variation of the S/N ratios of the tfa+dft (SNR1) and tfadft (SNR2) spectra as a function of the injected signal frequency for the two-component time series described in the text. The shading is proportional to SNR2 as indicated by the sidebars. For realistic (noisy) time series, the signal detection capability of the two methods become nearly the same. The result shown in the bottom panel is based on 10 realizations of the Gaussian noise added to the time series.
Current usage metrics show cumulative count of Article Views (full-text article views including HTML views, PDF and ePub downloads, according to the available data) and Abstracts Views on Vision4Press platform.
Data correspond to usage on the plateform after 2015. The current usage metrics is available 48-96 hours after online publication and is updated daily on week days.
Initial download of the metrics may take a while.