Fig. 11
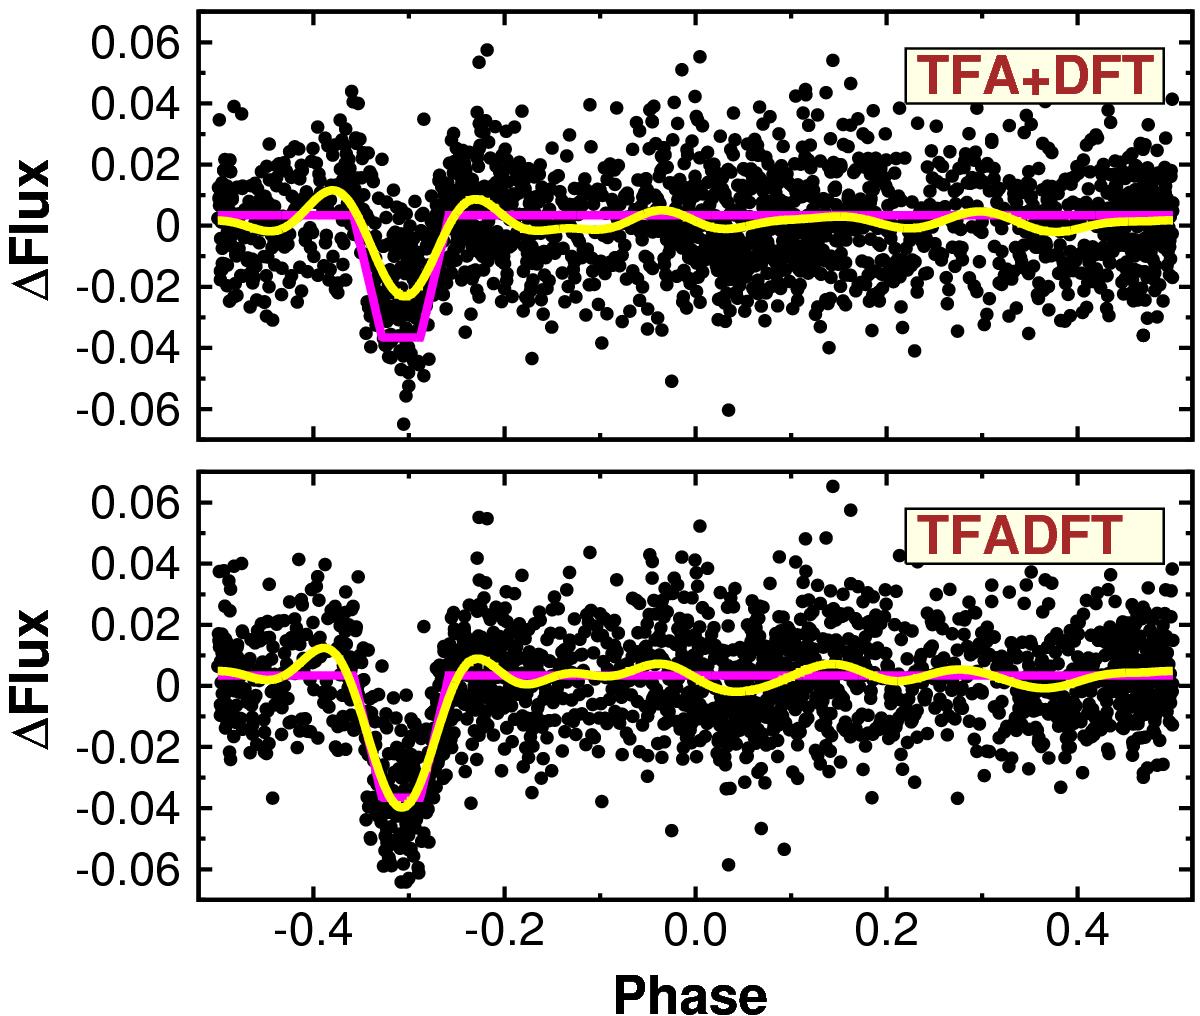
Folded light curves for the object with the frequency spectra shown in Fig. 10. The input trapezoidal transit signal is shown by pink line. The best 10th order Fourier fit is overpolotted by yellow line. The partial time series model (upper panel) yields shallower transit depth albeit both methods find the signal with the same significance.
Current usage metrics show cumulative count of Article Views (full-text article views including HTML views, PDF and ePub downloads, according to the available data) and Abstracts Views on Vision4Press platform.
Data correspond to usage on the plateform after 2015. The current usage metrics is available 48-96 hours after online publication and is updated daily on week days.
Initial download of the metrics may take a while.