Fig. 4
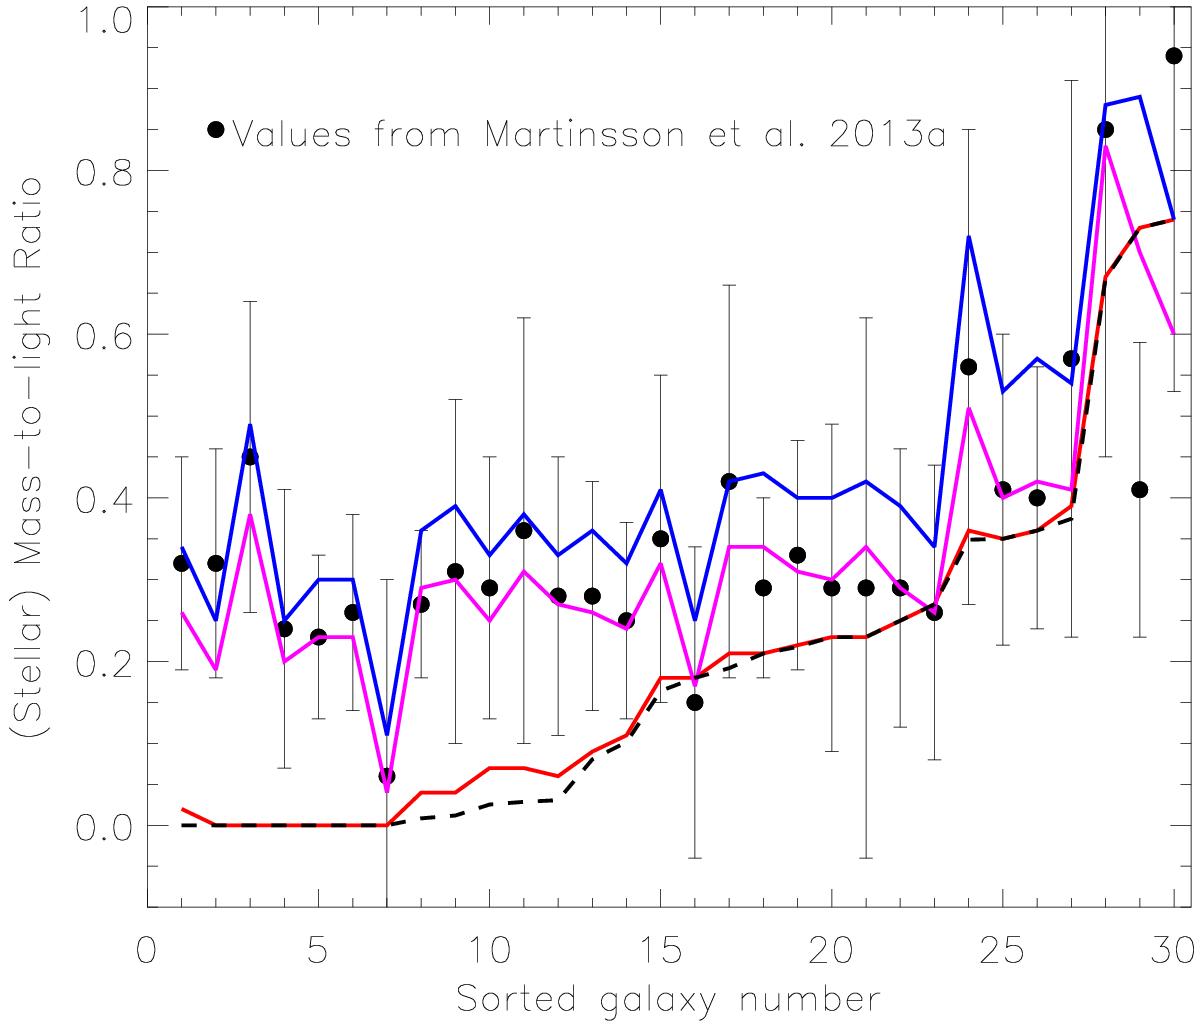
Mass-to-light ratios derived using the four methods described in Sect. 3.1 for all 30 galaxies from Martinsson (2013a). Black circles, with associated error bars, are the stellar mass-to-light ratios derived by Martinsson (2013a) for all 30 galaxies of the DiskMass Survey. The violet lines (case 1 from Sect. 3.1) are the mass-to-light ratios we found using the DiskMass Survey method (Eq. (6)). The blue lines (case 2 from Sect. 3.1) are the mass-to-light ratios found while accounting for the second term in the Poisson equation (Eq. (1)), but not the DM. The red lines (case 3 from Sect. 3.1) are the fitted stellar mass-to-light ratios after accounting for the second term in the Poisson equation and the DM needed to fit the original rotation curve (using the original mass-to-light ratio). The dashed black line (case 4 from Sect. 3.1) goes one step further and identifies the increased DM density required to offset the decreased stellar contribution to the rotation curve from the red line. The actual stellar mass-to-light ratio is then found iteratively. Each line has had the mass attributed to the molecular and atomic gas subtracted. Negative stellar mass-to-light ratios are fixed to zero.
Current usage metrics show cumulative count of Article Views (full-text article views including HTML views, PDF and ePub downloads, according to the available data) and Abstracts Views on Vision4Press platform.
Data correspond to usage on the plateform after 2015. The current usage metrics is available 48-96 hours after online publication and is updated daily on week days.
Initial download of the metrics may take a while.