Fig. 1
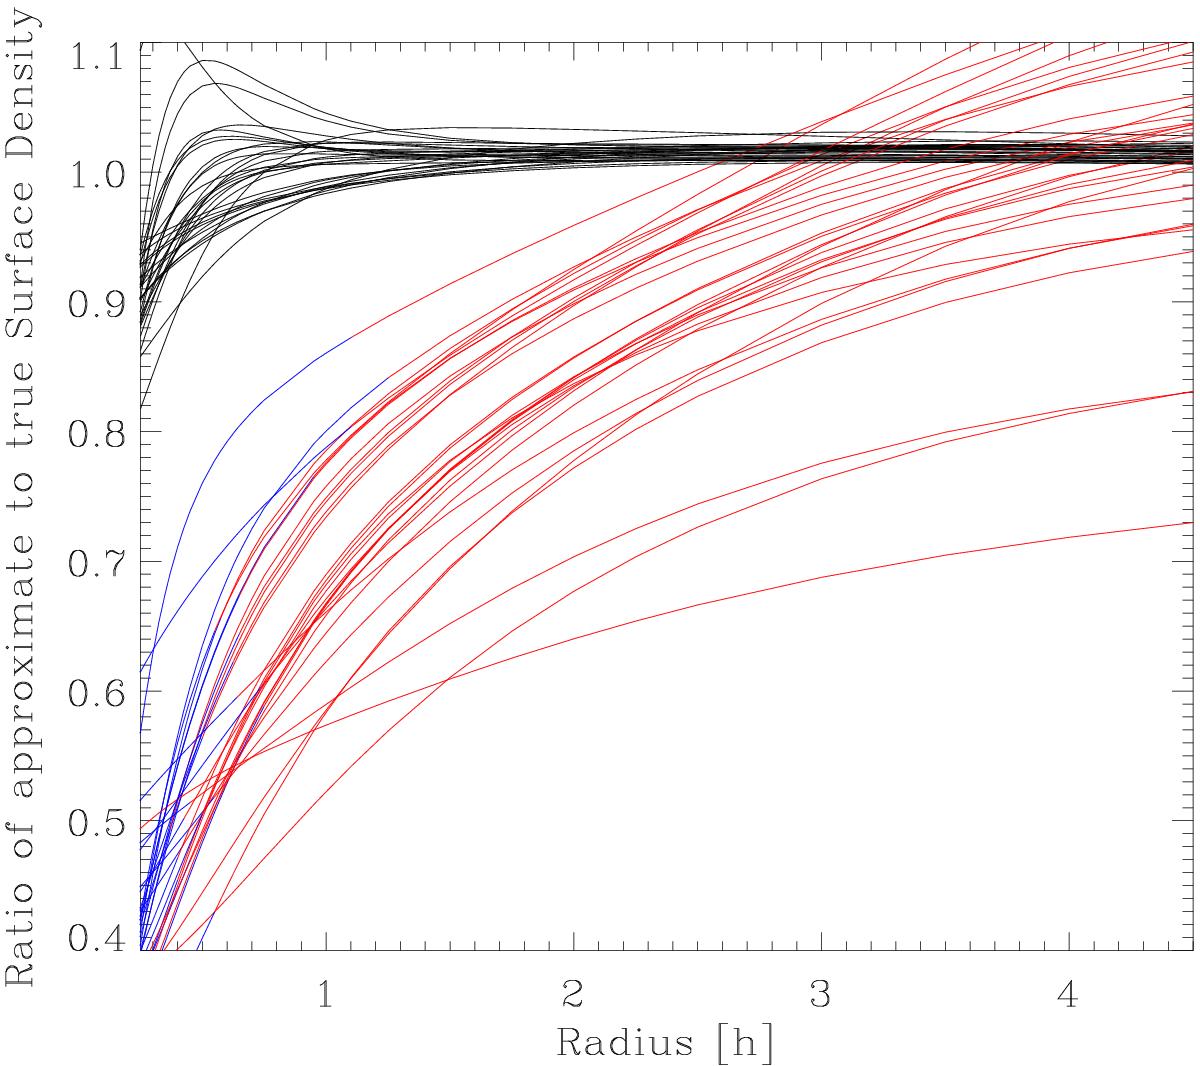
Ratio of the approximate total surface density to the true surface density as a function of radius. Each line represents the ratio of an approximate total surface density to the true total surface density within 3hz of the mid-plane for each galaxy as a function of radius. The black lines account for the radial derivatives in the Poisson equation (Eq. (8)) and the red lines neglect them (Eq. (7)). At radii where the bulge is significant, the red lines turn blue.
Current usage metrics show cumulative count of Article Views (full-text article views including HTML views, PDF and ePub downloads, according to the available data) and Abstracts Views on Vision4Press platform.
Data correspond to usage on the plateform after 2015. The current usage metrics is available 48-96 hours after online publication and is updated daily on week days.
Initial download of the metrics may take a while.