Fig. 6
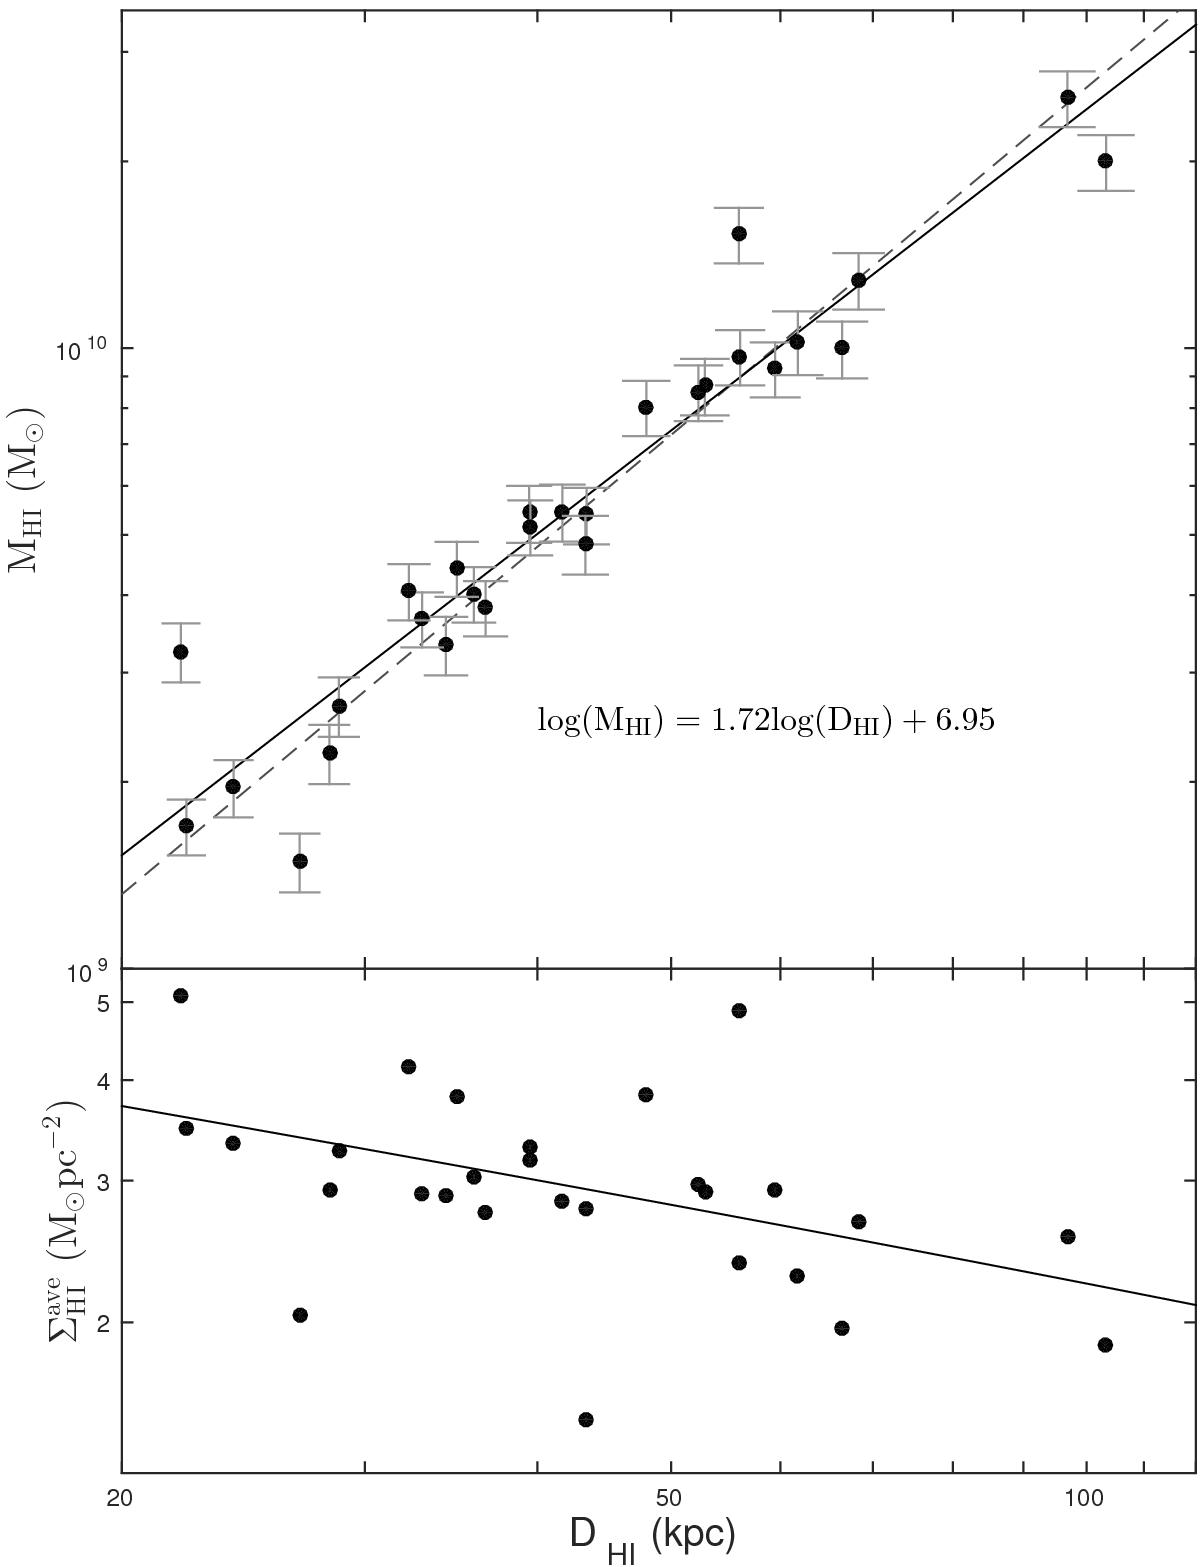
Upper panel: correlation between the total Hi mass (ℳHI) and the beam-corrected diameter of the Hi disk (DHI = 2RHI). The solid line shows the fit to the data while the dashed line represents the correlation found by Verheijen & Sancisi (2001). Lower panel: average Hi mass surface density within RHI versus DHI. The line indicates the expected slope based on the fit in the upper panel.
Current usage metrics show cumulative count of Article Views (full-text article views including HTML views, PDF and ePub downloads, according to the available data) and Abstracts Views on Vision4Press platform.
Data correspond to usage on the plateform after 2015. The current usage metrics is available 48-96 hours after online publication and is updated daily on week days.
Initial download of the metrics may take a while.