Fig. 4
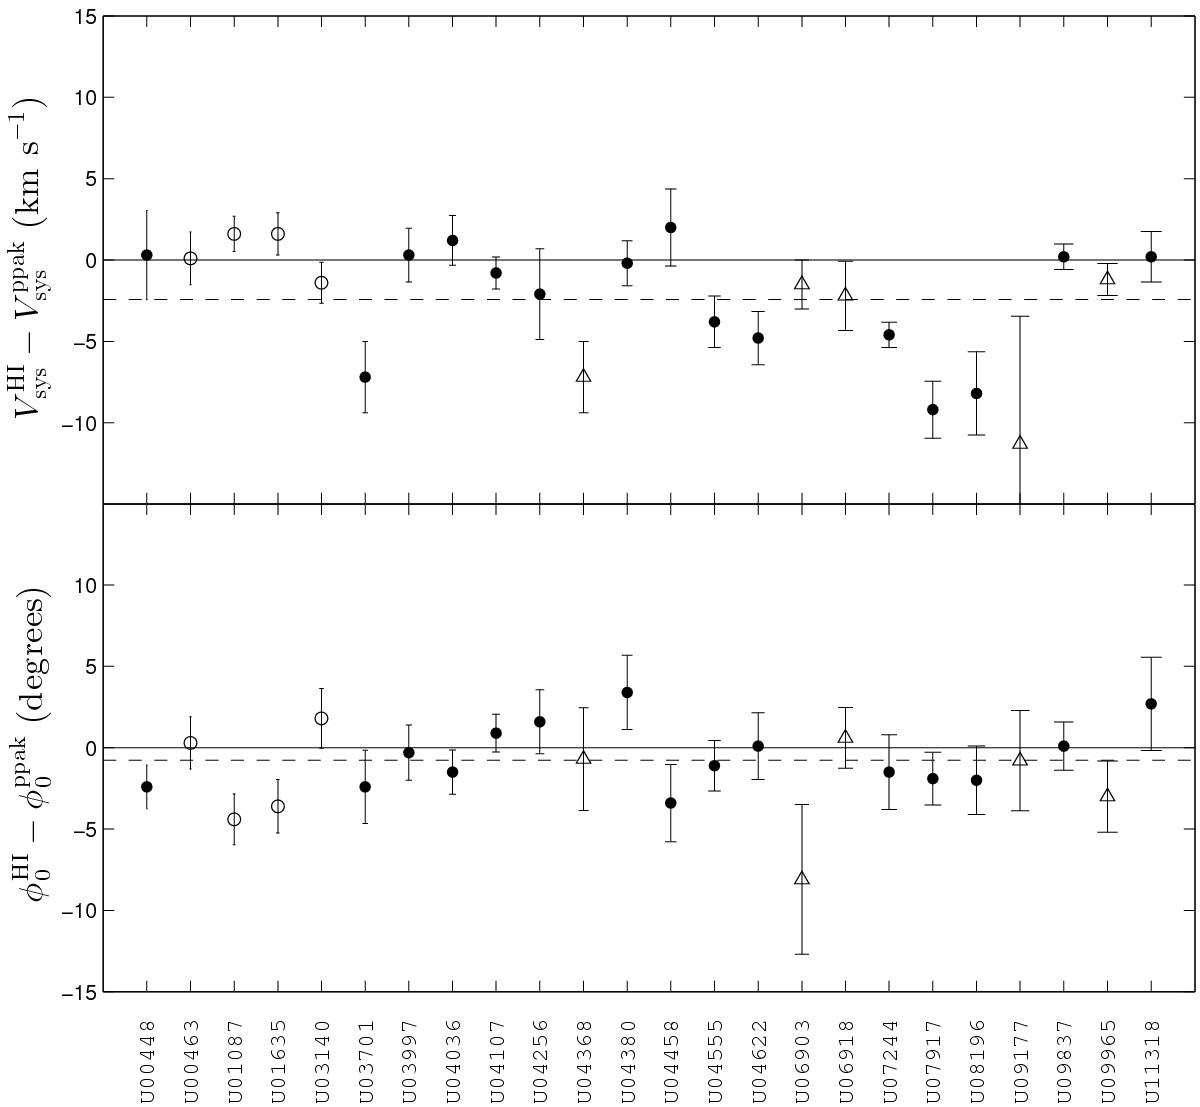
Comparison of results from Hi observations with those from optical PPak observations. The figure shows differences between the systemic velocities (upper panel) and between position angles of the kinematic major axis in the inner regions of the galaxies (lower panel), measured from the Hi velocity fields and those measured with the PPak IFU from [Oiii] and stellar velocity fields (Paper VI). The dashed horizontal lines show the average differences. Solid points correspond to WSRT data, open circles to VLA data, and open triangles to GMRT data.
Current usage metrics show cumulative count of Article Views (full-text article views including HTML views, PDF and ePub downloads, according to the available data) and Abstracts Views on Vision4Press platform.
Data correspond to usage on the plateform after 2015. The current usage metrics is available 48-96 hours after online publication and is updated daily on week days.
Initial download of the metrics may take a while.