Fig. 2
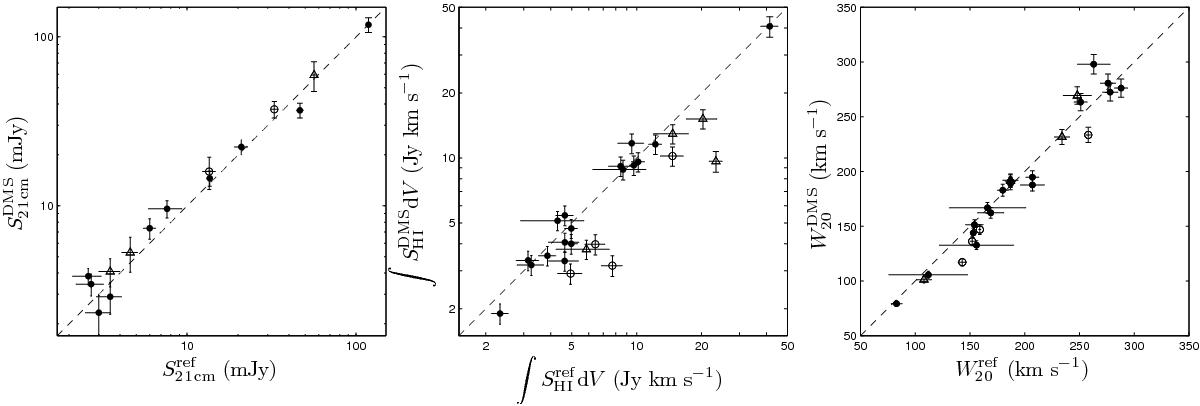
Comparison of our measurements with data from the literature. Left: total 21 cm radio continuum flux densities. Middle: integrated Hi line fluxes. Right: Hi line widths at the 20% level of peak intensity. Solid symbols represent data from the WSRT, open circles from the VLA, and open triangles from the GMRT. The data are listed in Table 3 with references to the literature values.
Current usage metrics show cumulative count of Article Views (full-text article views including HTML views, PDF and ePub downloads, according to the available data) and Abstracts Views on Vision4Press platform.
Data correspond to usage on the plateform after 2015. The current usage metrics is available 48-96 hours after online publication and is updated daily on week days.
Initial download of the metrics may take a while.