Fig. 14
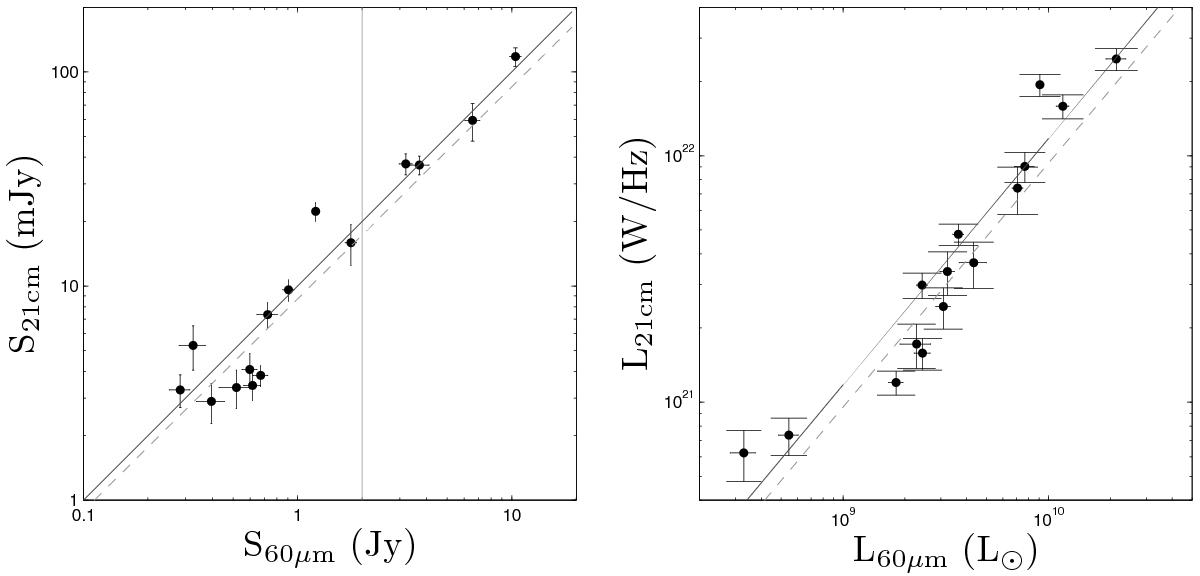
Radio-infrared correlation of 15 galaxies in the reduced Hi sample detected by IRAS at 60 μm. Left: correlation between flux densities. The solid line indicates the simple relation S21cm = 0.01S60 μm. The dashed line shows the correlation found by Yun et al. (2001) for the IRAS 2 Jy sample. The vertical line indicates their lower flux-density limit of 2 Jy. Right: correlation between intrinsic radio and infrared luminosities.
Current usage metrics show cumulative count of Article Views (full-text article views including HTML views, PDF and ePub downloads, according to the available data) and Abstracts Views on Vision4Press platform.
Data correspond to usage on the plateform after 2015. The current usage metrics is available 48-96 hours after online publication and is updated daily on week days.
Initial download of the metrics may take a while.